. 2022 Feb 17;11:e71864. doi: 10.7554/eLife.71864

Figure 8. Genes with differential expression profiles between E12.5 and E14.5 ganglionic eminences.

(A–D) RNAscope HiPlexUp assay of genes differentially expressed in VZ and SVZ cells between E12.5 and E14.5 on coronal sections through the GEs. Dashed circles on the UMAP plot (A) indicate the clouds that are strongly enriched for E12.5 cells (dark green) and E14.5 cells (dark red). Scale bar in A = 200 μm. Dotplot in (A) contains high Nestin-expressing cells from E12.5 and E14.5, dotplots in B-D consist of all E12.5 and E14.5 cells.

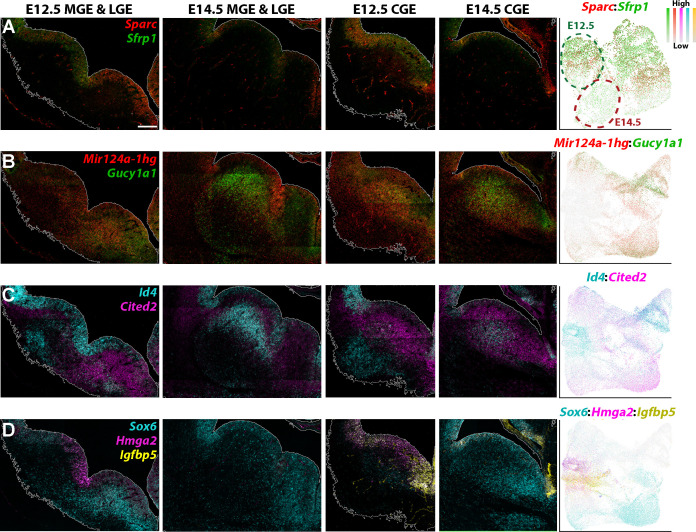
Figure 8.

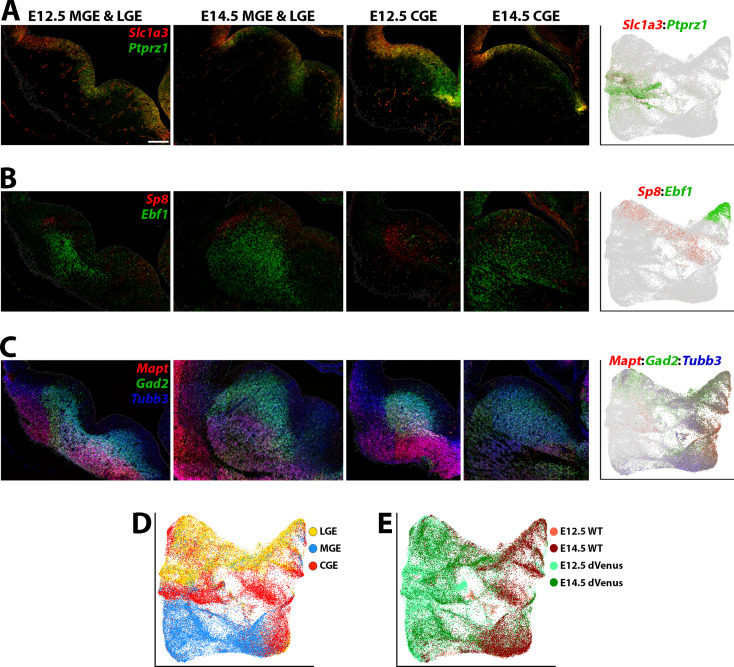
Figure 8—figure supplement 1. Genes with similar expression profiles between E12.5 and E14.5 ganglionic eminences.

Figure 8—figure supplement 1.

(A–C) Left, RNAscope HiPlexUp assay of genes displaying similar expression profiles in VZ and/or SVZ cells between E12.5 and E14.5. Right, UMAP plots of the genes depicted in the in situ panels. Scale bar in A = 200 μm. (D–E) UMAP plots of all E12.5 and E14.5 cells annotated by brain region (D) and mouse line and embryonic timepoint (E).