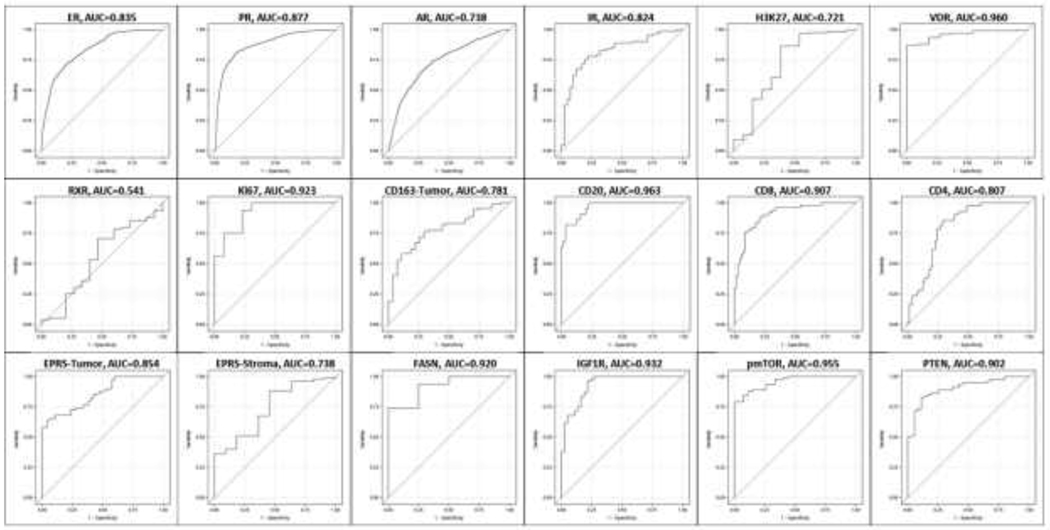
Figure 3. Receiver-operator characteristic curves.
The binary pathologist assessment (any positive versus negative, high/moderate versus low, or >14% (the cutpoint for Ki67) was used as the gold standard. No ROC curve was generated for CD163 in stroma because no cases were assigned negative by the pathologist. The best performing markers were VDR, Ki67, CD20, CD8, FASN, IGF1R, pmTOR, and PTEN (area under the curve (AUC) > 0.9), while the worst performing was RXR (AUC = 0.541). For the remaining markers, the AUC was above 0.7.

