
Figure 2.
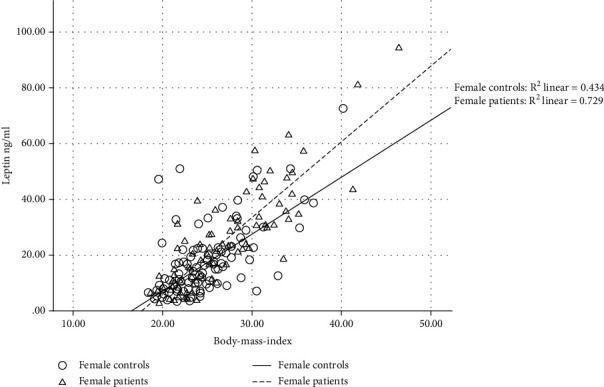
BMI is plotted against serum leptin levels in female patients and controls. A strong correlation was found in female controls (R2 = 0.434) and even stronger in female patients (R2 = 0.729) with a significance level of p < 0.0001 in Spearman correlation analysis.