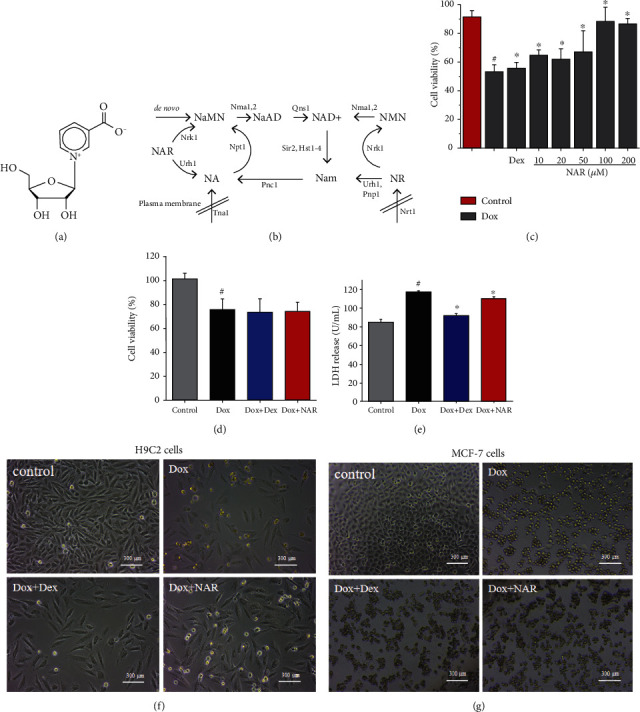
Figure 1.

(a) The molecular structure of NAR. (b) Model of NAD+ biosynthesis pathways [14].The effect of NAR and Dox administration alone or in combination on cell viability. (c) The cytotoxic effect of different concentrations NAR and Dox alone or in combination on H9c2 cardiomyocytes. (d) The effect of NAR combined with Dox on the cell viability of MCF-7 breast cancer cells. (e) Levels of LDH release. (f) Microstructures of the H9c2 cells under different treatments. Scale bar = 300 μm. (g) Microstructures of the MCF-7 cells under different treatments. Scale bar = 300 μm. The results were analyzed using One-way ANOVA and Student t-tests. Data are presented as the mean ± SEM. Significance is indicated as P < 0.05. Versus the control, #P < 0.05; versus the Dox group, ∗P < 0.05.
