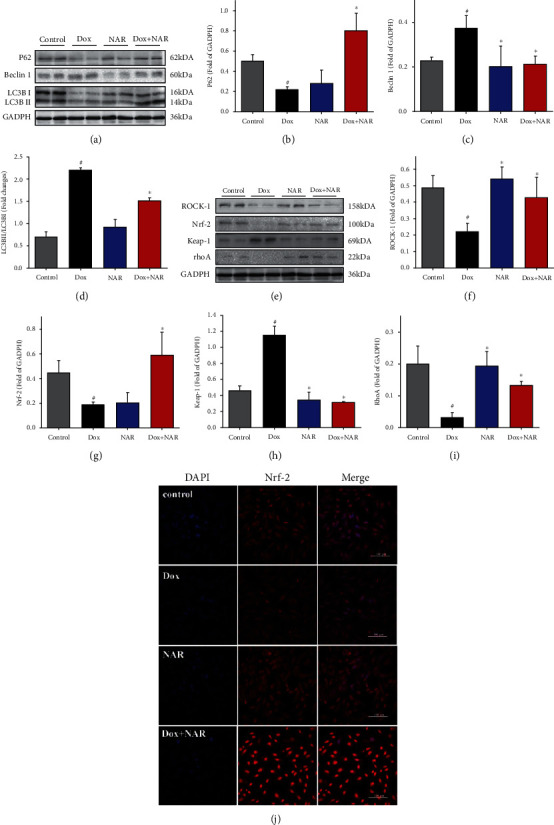
Figure 6.

The effect of Dox and NAR on the expression level of oxidative stress proteins and cardiac autophagic proteins after 24 h treatment. (a) Expression of cardiac autophagic proteins in different treatment groups. Densitometric analysis of (b) P62; (c) Beclin 1 and (d) LC3B. (e) Expression of cardiac oxidative stress proteins in different treatment groups. Densitometric analysis of: (f) ROCK-1; (g) Nrf-2; (h) Keap-1; (i) RhoA. The figure shows a representative blot for that protein. The values were expressed as fold changes over the level of GADPH, which served as a loading control. Data were represented as mean ± SEM. #P < 0.05 compared to control; ∗P < 0.05 compared to Dox. (j) The localization of Nrf-2 was examined by confocal microscopy (magnification×40). Scale bar = 100 μm.
