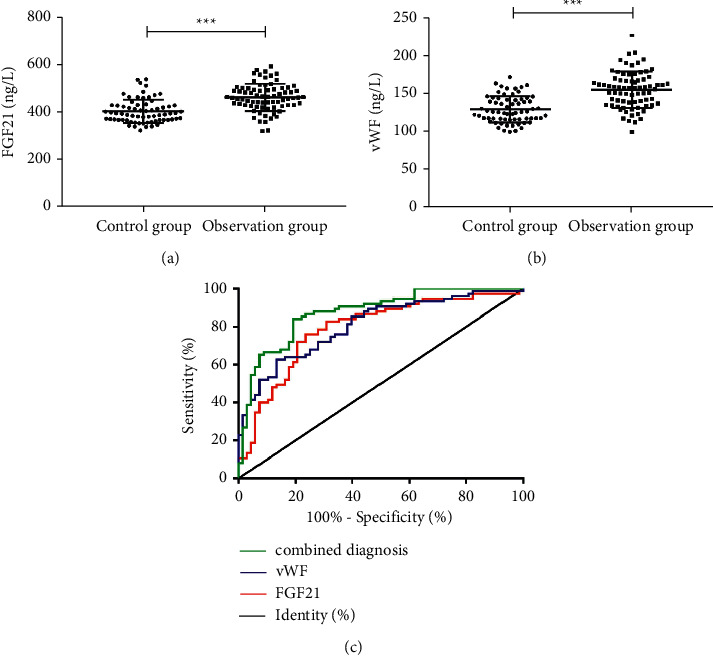
Figure 1.

Expression levels of FGF21 and vWF. (a) FGF21 levels are markedly higher in OG than in CG (t = 6.496, p < 0.001). (b) vWF levels are markedly higher in OG than in CG (t = 7.297, p < 0.001). ∗∗∗P < 0.001. (c) ROC curves demonstrate the diagnosis of CAS by FGF21 and vWF.
