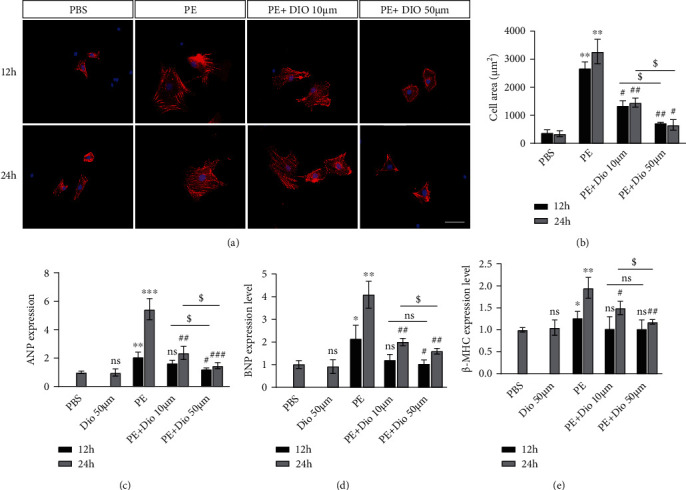
Figure 2.

The impact of diosmetin on cardiomyocyte hypertrophy induced by PE. (a) Representative immunofluorescent images of NRVM stained with sarcomeric α-actinin (green) and DAPI (blue) and quantification of NRVM size (b), scale bar: 50 μm, n = 3. (c–e) Quantitative real-time PCR analysis mRNA expression of hypertrophic markers ANP, BNP, and β-MHC. Data are presented as mean ± SEM. ∗p <0.05, ∗∗p < 0.01, and ∗∗∗p < 0.001 vs. the PBS group; #p <0.05, ##p < 0.01, and ###p < 0.001 vs. the PE (12 h) group; $p <0.05, $$p < 0.01, and $$$p < 0.001 vs. the PE (24 h) group; §p <0.05 vs. the PE+Dio group; ns: not significant.
