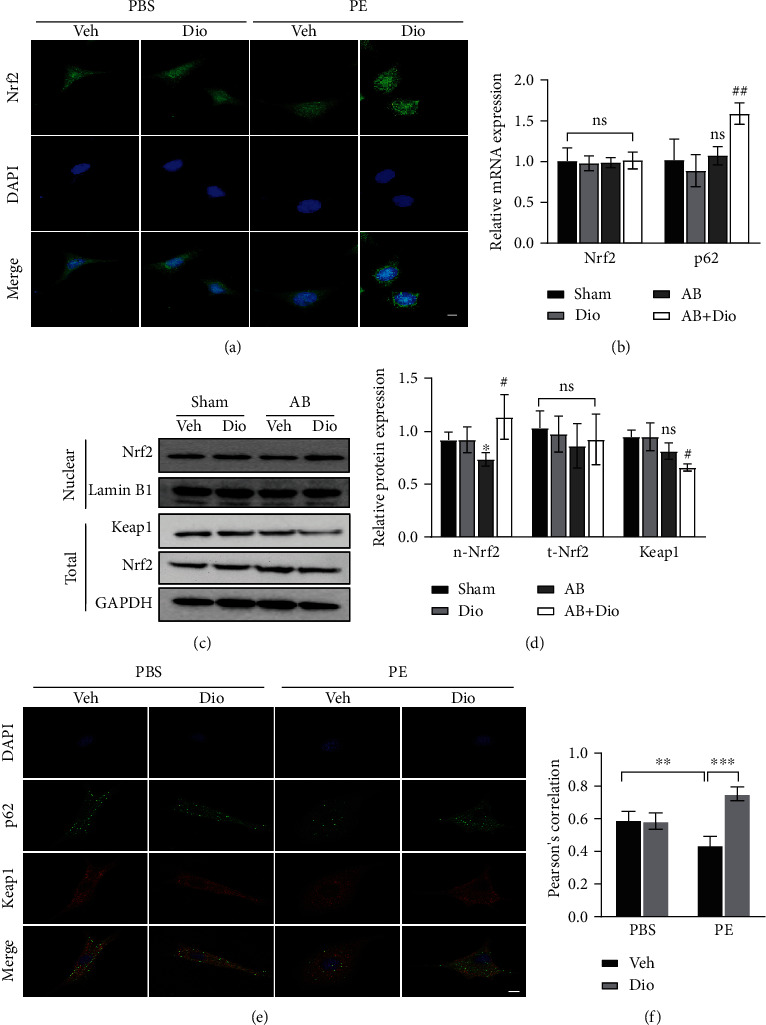
Figure 4.

NRF2 signaling pathway is activated in response to diosmetin both in vivo and in vitro. (a) Representative immunofluorescence images of cells stained for Nrf2 (green) and nuclei with DAPI (blue), scale bar: 20 μm, n = 3. (b) Level of mRNA analysed by real-time PCR in vivo, n = 3. (c, d) Representative western blots of Nrf2, Keap1, Lamin B1, and GAPDH protein level. (e) Representative confocal images of p62 (green) and Keap1 (red) signal colocalization and nuclei stained with DAPI (blue), scale bar: 10 μm. (f) Quantitative analysis of confocal images, n =6. Data are presented as mean ± SEM. ∗p <0.05, ∗∗p < 0.01, and ∗∗∗p < 0.001 vs. the sham group, #p <0.05, ##p < 0.01 vs. the AB group; ns: not significant.
