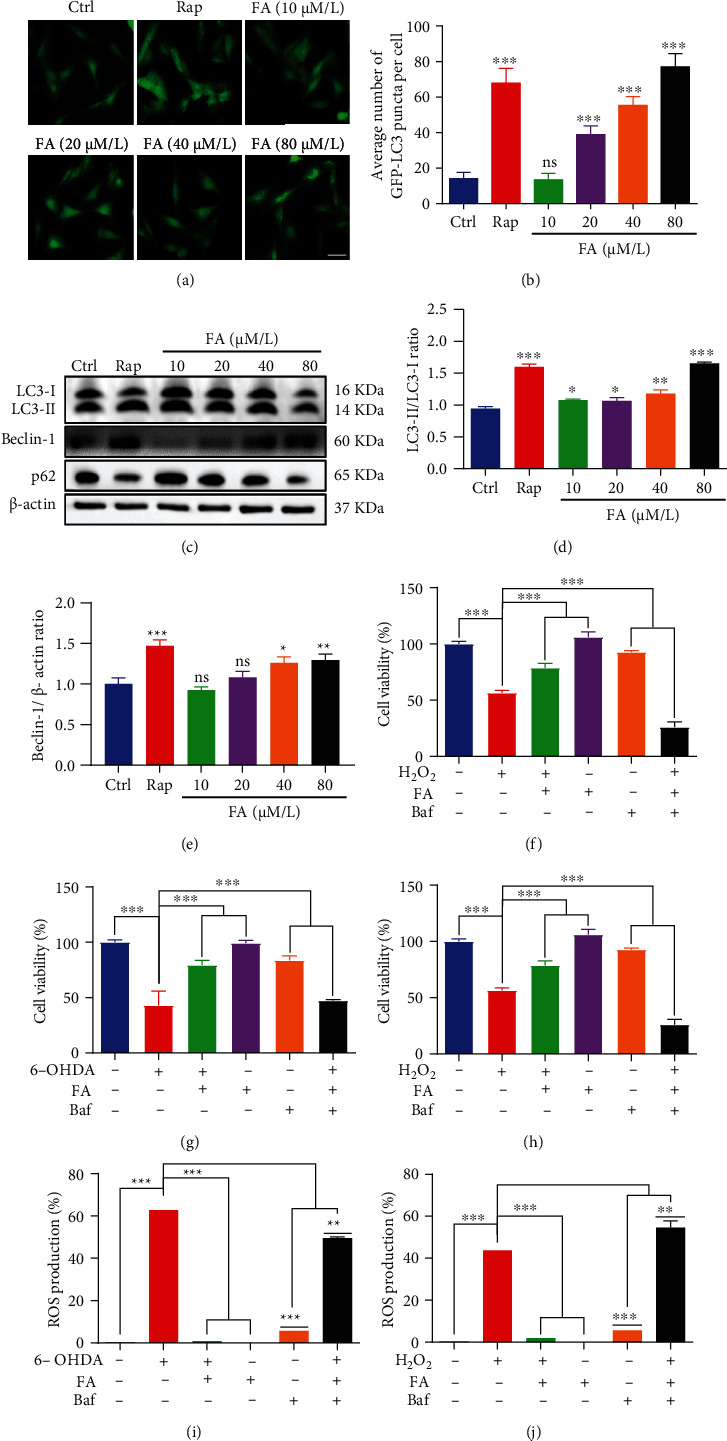
Figure 10.

FA induces autophagy and inhibits 6-OHDA- or H2O2-induced cell death and ROS accumulation via autophagy activation in PC-12 cells. (a) Stable RFP-GFP-LC3 U87 cells were treated with FA at the indicated concentrations or Rap (0.5 μM) for 24 h. Representative images with GFP-LC3 puncta formation were captured (magnification, ×40). Scale bar: 100 μm. (b) The bar chart represents the number of GFP-LC3 puncta per cell. Bars, SD, nsp > 0.05 and ∗∗∗p ≤ 0.001. (c–f) PC-12 cells were treated with FA or Rap at the indicated concentrations for 24 h. Then, cell lysates were harvested for the detection of LC3-I, LC3-II, Beclin 1, and SQSTM1/p62 proteins using Western blotting. The bar charts, respectively, indicate the ratio of LC3-II/LC3-I (d) and the levels of Beclin 1(e) and SQSTM1/p62 (f) proteins. Bars, SD, nsp > 0.05, ∗p ≤ 0.05, ∗∗p ≤ 0.01, and ∗∗∗p ≤ 0.001. (g, h) 6-OHDA- or H2O2-induced PC-12 cells were treated with FA in the absence or presence of Baf for 24 h. After treatment, the cell viability was measured by the MTT assay. The bar chart indicates the viability of PC-12 cells. Data were collected from three independent experiments and expressed as the mean ± SD. ∗∗∗p ≤ 0.001. (i, j) 6-OHDA- or H2O2-induced PC-12 cells were treated with FA in the absence or presence of Baf for 24 h. After treatment, the cells were incubated with an H2DCFDA probe, and the GFP intensity was analyzed by flow cytometry. The bar charts present the GFP intensity indicating the ROS levels of PC-12 cells. Data were collected from three independent experiments and expressed as the mean ± SD. ∗∗∗p ≤ 0.001.
