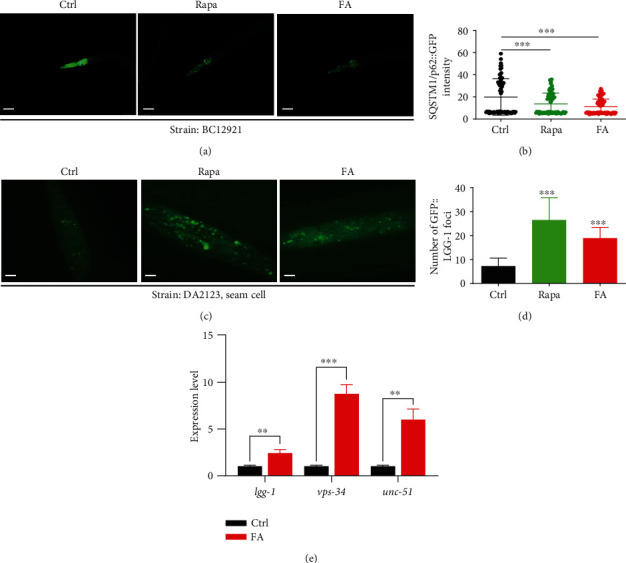
Figure 3.

FA induces autophagy in C. elegans. (a) BC12921 worms with the GFP signal were treated with FA (50 μM) or Rap (20 μM) for 48 h. Then, the representative images of worms were captured by using a fluorescence microscope. Scale bars: 50 μm. (b) The bar chart indicates the GFP intensity reflecting the expression of SQSTM1/p62 proteins in BC12921 worms. Data were collected from at least 20 worms and expressed as the mean ± SD. ∗∗∗p ≤ 0.001. (c) Representative images of DA2123 worms treated with FA (50 μM) or Rap (20 μM) for 48 h were captured by using a fluorescence microscope. Scale bars: 20 μm. (d) The bar chart indicates the mean number of GFP::LGG-1 puncta in the same size area of DA2123 worms. Data were collected from at least 20 worms and expressed as the mean ± SD. ∗∗∗p ≤ 0.001. (e) N2 worms were treated with FA for 48 h. Then, qRT-PCR was performed to analyze the mRNA expression of 3 autophagy-related genes. The bar chart indicates the relative expression levels of lgg-1, vps-34, and unc-51. Data were collected from three independent experiments and expressed as the mean ± SE. ∗∗p ≤ 0.01 and ∗∗∗p ≤ 0.001.
