
Figure 3.
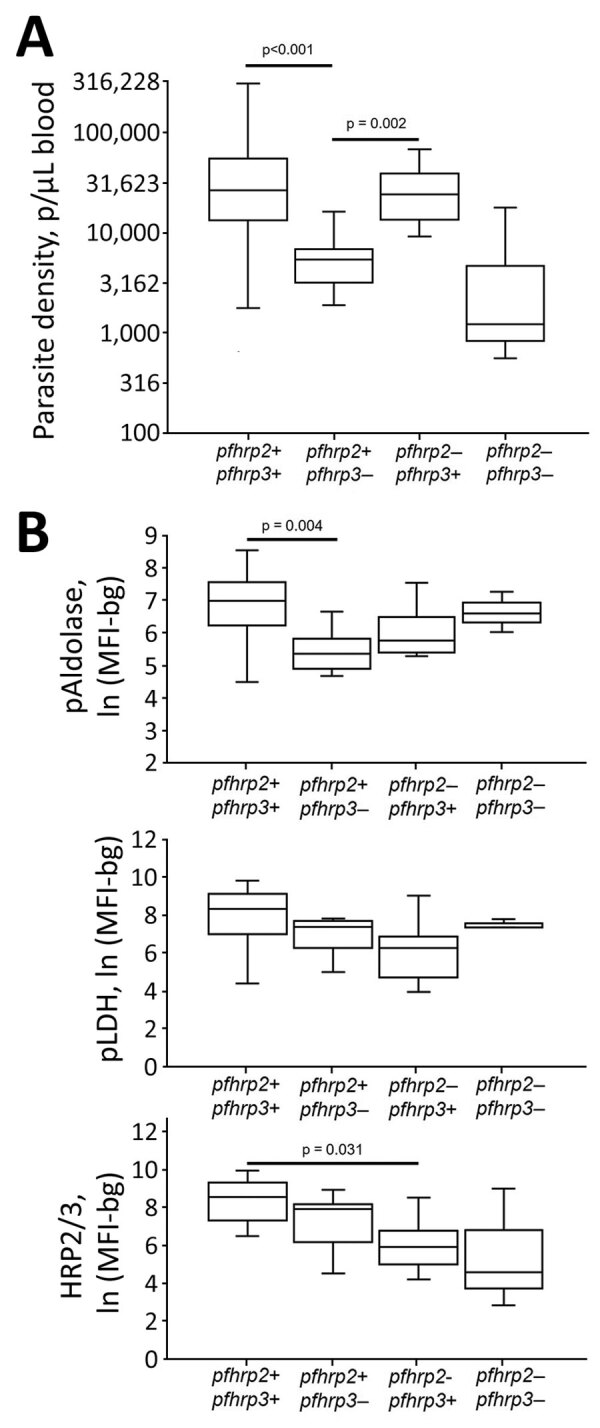
Plasmodium falciparum parasite density and antigen levels by pfhrp2/3 genotype in study of Plasmodium falciparum malaria-infected participants, Ethopia, Kenya, Madagascar, and Rwanda, 2016–2018. A) Peripheral blood parasite density as determined by light microscopy. B) Log-transformed assay signal to pAldolase, pLDH, and HRP2/3 antigens. Boxes display interquartile range, horizontal lines within boxes indicate medians, and whiskers indicate 1.5× interquartile range. Significant differences in means are indicated with corresponding p values. Within each plot, all other differences among genotypes did not reach statistical significance at α = 0.05. HRP2/3, histidine-rich protein 2/3; ln (MFI-bg), log-transformed median fluorescence intensity minus background value; pAldolase, pan-Plasmodium aldolase; pLDH, pan-Plasmodium lactate dehydrogenase.