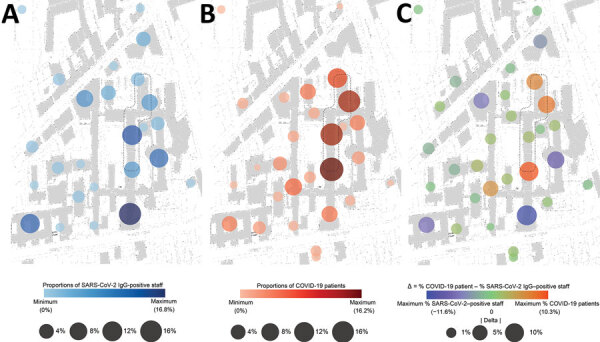
Figure 3.

Spatiotemporal trajectories of severe acute respiratory syndrome coronavirus 2‒infected patients and staff mobility in university hospital, Munich, Germany. A) Cumulative representation of proportions of seropositive staff. B) Cumulative representation of proportions of COVID-19-patients. C) Differences (Δ) for staff and patients between different hospital areas. Difference are indicated by dot plots and assigned to distinct hospital areas. For purposes of discretion of data from study participants, the graphic representation of spatial information is partially distorted. Dashed lines indicate COVID-19‒designated areas in the hospital.
