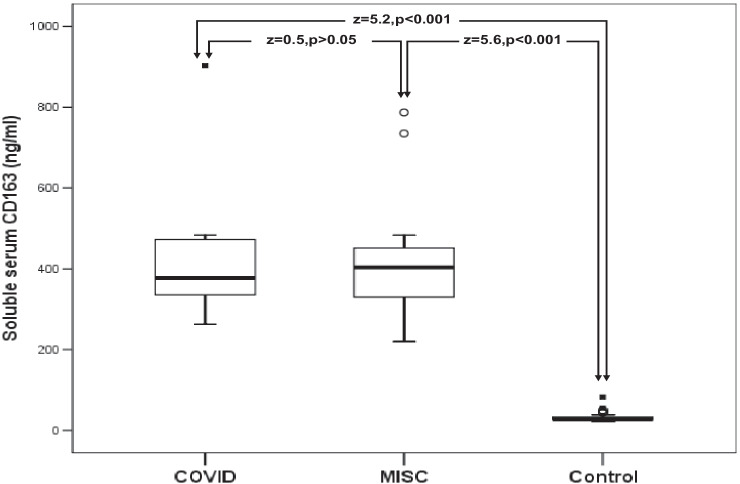
Fig. 2.
Comparison between patients with SARS-CoV-2 and healthy control children in serum levels of sCD163. The boxes enclose the interquartile ranges (IQR) which are between the 25th and the 75th percentiles. The horizontal line inside the box represents the median, and the whiskers represent the non-outlier or extreme maximum and minimum values. The closed small squares represent extreme values (more than 3 IQR), and small open circles represent the outlier values (between 1.5 and 3 IQR)

