Fig. 6.

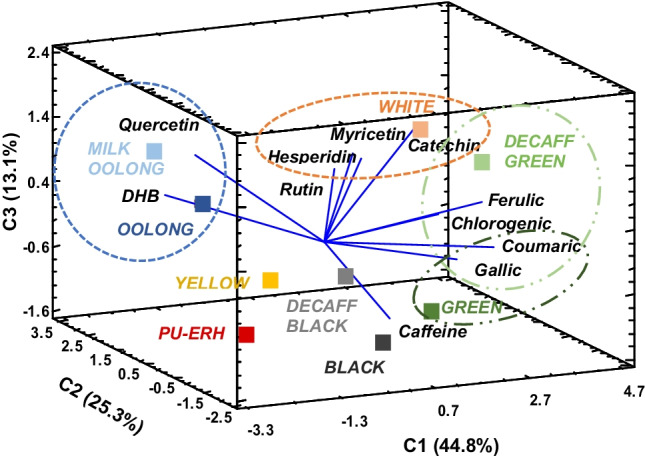
Three-dimensional PCA plot of nine tea infusions (scores, mean values n ≥ 6) in relation to the bioaccessibility indices (IVBA) of the polyphenols studied and caffeine. The ellipses show the association of the analytes (loadings) and samples

Three-dimensional PCA plot of nine tea infusions (scores, mean values n ≥ 6) in relation to the bioaccessibility indices (IVBA) of the polyphenols studied and caffeine. The ellipses show the association of the analytes (loadings) and samples