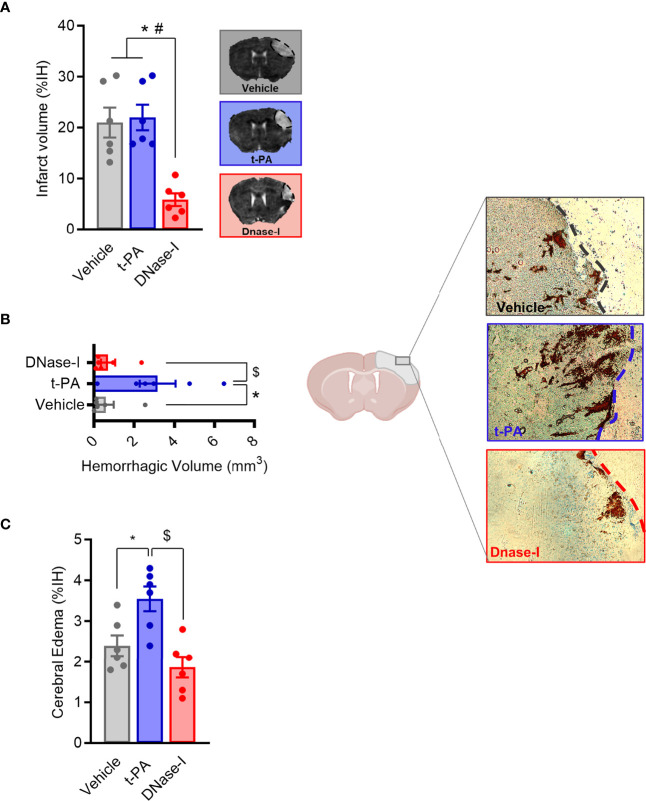
Figure 2.
Effect of t-PA and DNase-I treatments administrated 3 hours thromboembolic occlusion. (A) Infarct volume determined 24 hours after the occlusion. (B) Hemorrhagic volume (mm3). (C) Cerebral edema. Data are mean± SEM (n = 6 *p < 0.05 vs vehicle; #p < 0.05 tPA vs DNase-I; $p < 0.05 tPA vs DNase-I).

