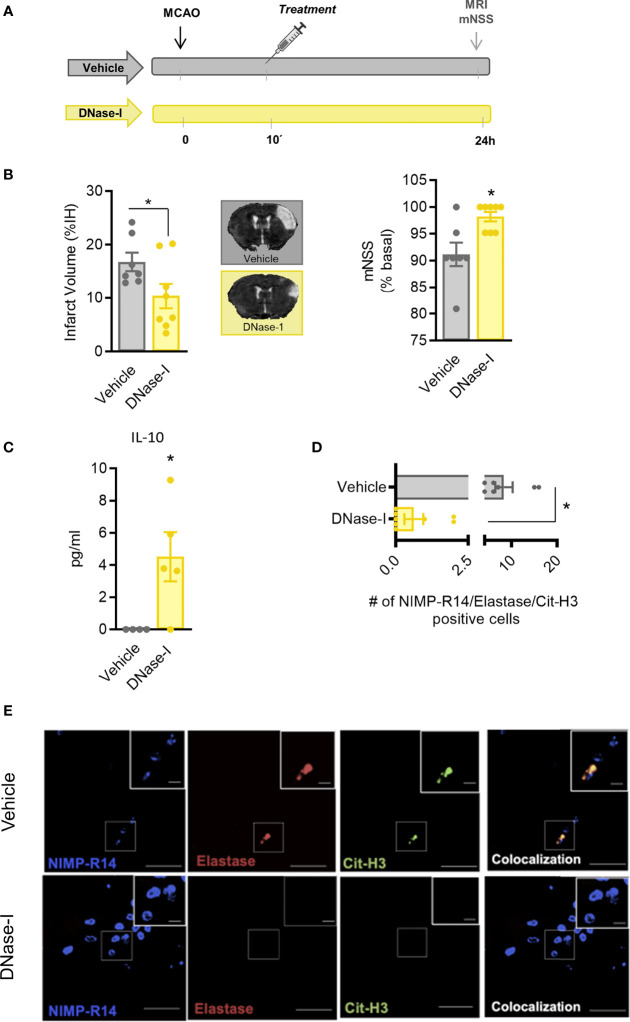
Figure 3.
Effect of DNase-I treatment after stroke. (A) Design of the study. (B) Infarct volumes determined 24 hours after the occlusion. (C) Effect of DNase-I on plasma concentration of IL (interleukin)-10 24 hours after the occlusion. (D) Number of NIMP-R14, elastase and Cit-H3-positive cells. (E) Representative images. Data are mean± SEM (n = 4-8 *p < 0.05 vs vehicle).

