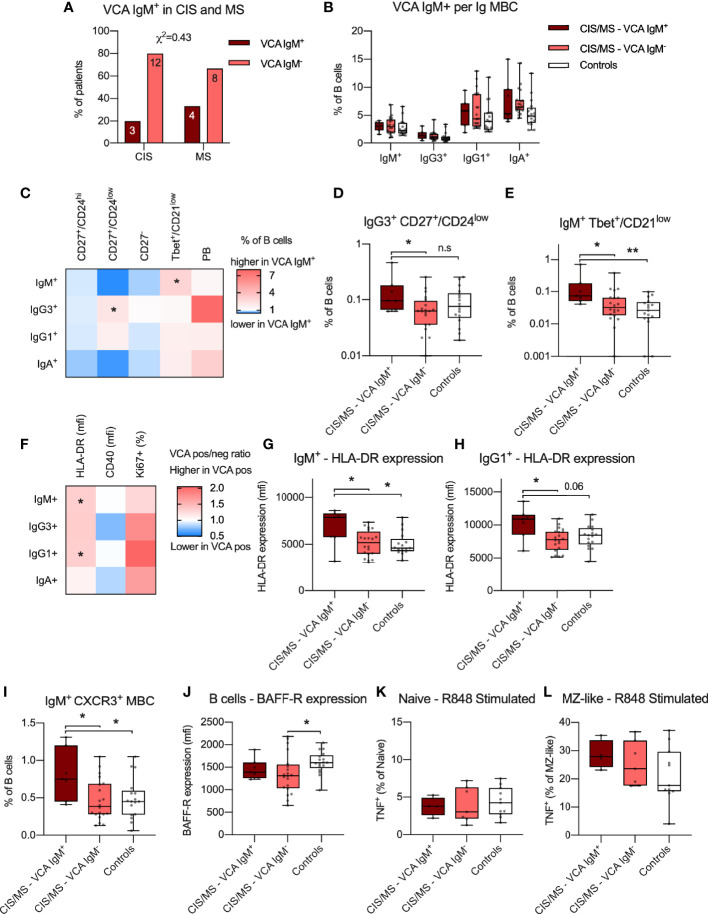
Figure 7.
(A) Proportion of VCA IgM+ individuals with CIS or MS. Abundance of IgM+, IgG3+, IgG1+ and IgA+ MBC within the B cell population in VCA IgM+, VCA IgM- CIS/MS patients as well as controls. (C–E) Differences in mean ratio in VCA IgM+ compared to VCA IgM- CIS/MS patients (C) for each MBC subset as well as raw data for significantly different subsets (D, E). (F–H) Differences in mean ratio in VCA IgM+ compared to VCA IgM- CIS/MS patients for expression of HLA-DR, CD40 as well as proportion of Ki67+ MBC within each MBC subset (F) as well as raw data for significantly different subsets (G, H). (I) Proportion of IgM+ CXCR3+ MBC in VCA IgM+, VCA IgM- and controls. (J) Expression of BAFF-R on BAFF-R+ B cells in VCA IgM+ and VCA IgM- CIS/MS and controls. (K, L) Proportion of TNF+ Naive (K) and MZ-like (L) B cells following R848 stimulation in VCA IgM+ and VCA IgM- CIS/MS patients and controls. Data in (A) are displayed as proportion and number of CIS and MS patients. Data in (B, D, E, G–L) are displayed for each participant, together with box/whiskers display for median and range (n VCA IgM Ab+ = 7, n VCA IgM Ab- = 20, n Controls = 17) and in K-L (n VCA IgM Ab+ = 4, n VCA IgM Ab- = 7, n Controls = 11). Data in (C, F) are displayed as means of VCA IgM+ and VCA IgM- ratios. Significance of difference between distribution of individuals was calculated using the χ2 test. For comparisons across multiple groups a Kruskal-Wallis test followed by a post test was used, for comparison between two groups Mann-Whitney’s non-parametric test was used. All statistical analysis was performed on the raw data and significance of differences is displayed as p<0.01, **, p<0.05, * or for p<0.1, as specific p-value; n.s., not significant.

