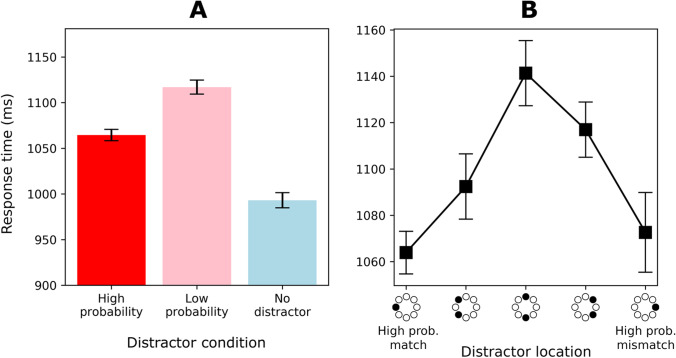
Fig. 3.
Response time (RT) results of Experiment 1. Error bars indicate 95% within-subject confidence intervals (Cousineau, 2005). (A) Mean RTs for high-probability, low-probability, and no-distractor conditions. Note that “high probability” refers to both high-probability locations (irrespective of context), and “low probability” refers to the six remaining locations. (B) Mean RTs as a function of distractor location, coded as the distance from the high-probability location of the current context (high-probability match)

