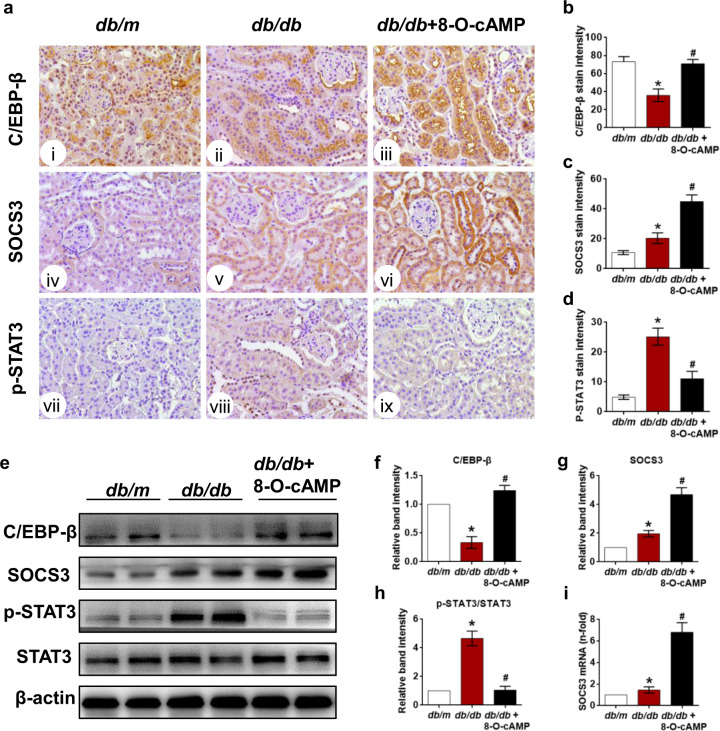
Fig. 4. Effect of the Epac agonist on renal C/EBP-β, SOCS3 and p-STAT3 expression.
a The location and expression of C/EBP-β (i–iii), SOCS3 (iv–vi) and p-STAT (vii–ix) were assessed by IHC in each group (400×). b–d Quantification of C/EBP-β, SOCS3, and p-STAT expression in kidney tissues (n = 5). e The expression of C/EBP-β, SOCS3, and p-STAT (Tyr705) was measured by Western blotting. f–h Quantification of the Western blot results (n = 3). i Relative SOCS3 mRNA expression in kidney tissues (n = 3). The values are the mean ± SD; *P < 0.05 vs db/m, #P < 0.05 vs db/db mice.

