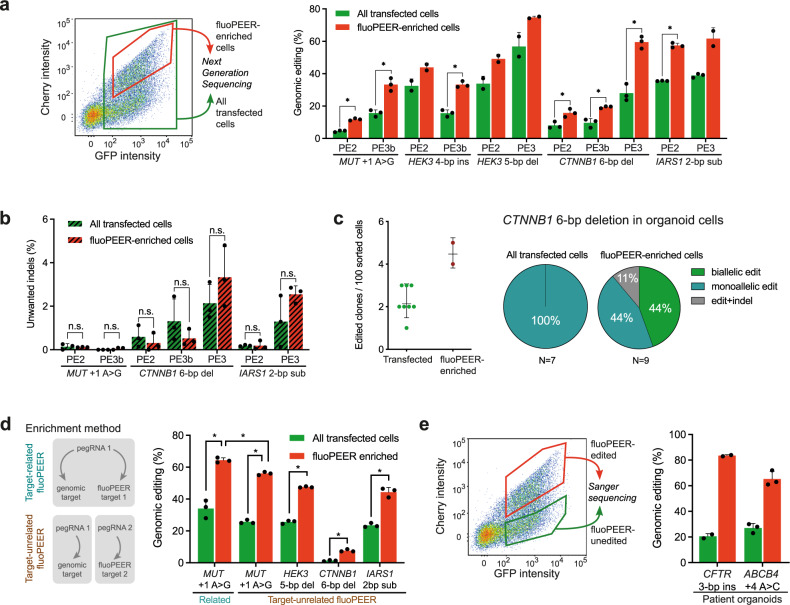
Fig. 3. FluoPEER enriches for genomic editing.
a FACS sorting based on transfection of the reporter plasmid (GFP+) and presence of reporter editing (GFP+Cherry+) shows enrichment for genomic editing of various genes for PE2 and PE3(b) in the reporter-edited HEK293T cells. Successful editing was quantified by NGS. Note that the HEK3 4-bp insertion PE2 condition was performed with NGG-PE2, while the corresponding PE3b condition was performed with SpG-PE2, resulting in lower editing. b FluoPEER-enrichment of genomic editing does not increase unwanted indels in HEK293T cells, as quantified by NGS. Significance was analyzed using a two-tailed unpaired Student’s t test (*P < 0.05) for n = 3 biologically independent replicates for a and b. c Activating CTNNB1 mutations in liver-derived organoid cells allow sustained organoid growth despite removal of Wnt-activator Rspo1 from the culture medium2. When creating an activating 6-bp deletion in CTNNB1 by prime editing, FluoPEER-enrichment resulted in outgrowth of more Rspo1-independent liver organoid clones, compared to regular transfection sorting. From the clones with activating CTNNB1 mutations, only the clones obtained by fluoPEER-enrichment contained biallelic CTNNB1 mutations. d Use of an unrelated fluoPEER allows enrichment for a genomic edit. Either HEK293T cells were transfected with the fluoPEER corresponding to the genomic mutation or transfected with a fluoPEER unrelated to the genomic mutation. It should be noted that enrichment with the ‘related’ fluoPEER still yields the highest editing percentage. Significance was analyzed using a two-tailed unpaired Student’s t test (*P < 0.05) for n = 3 biologically independent replicates. e Pathogenic mutations in patient colon (CFTRF508del) and liver (ABCB4E1012X) organoids were targeted by PE3 and sorted 72 h after transection based on fluoPEER editing. Reporter-edited organoid cells were enriched for genomic editing compared to reporter-unedited organoid cells. Error bars represent standard deviations from the mean of n = 2–3 biologically independent replicates. Source data are provided as a Source Data file.

