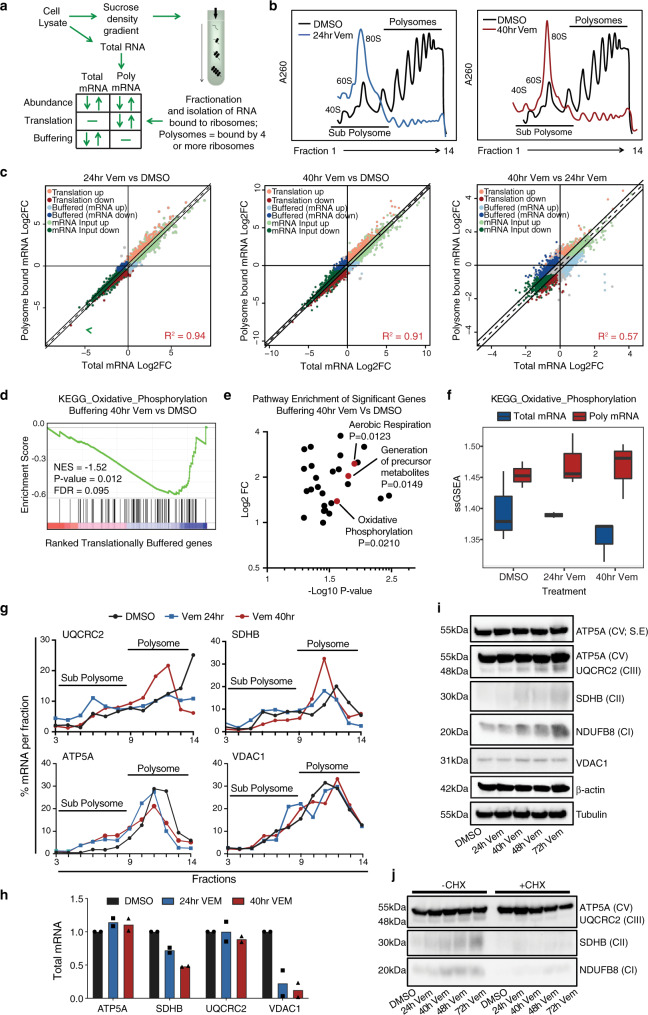
Fig. 2. BRAFi induces transcriptional and translational reprogramming of metabolism in BRAFV600 melanoma cells.
a Schematic summarising the polysome profiling assay and different modes of gene expression identified using anota2seq applied to RNA sequencing samples. b Polysome profiles of A375 cells treated with either DMSO or 1 μM Vem for the indicated time on a 10–40% sucrose gradient (representative of n = 3 biologically independent experiments). c Scatterplots of Log2 fold change (Log2FC) total mRNA vs polysome-bound (translated) mRNA in cells treated with DMSO or 1 μM Vem for the indicated time. Different modes of gene expression identified by anota2seq are shown. See Supplementary Data 5 for source data (n = 3 biologically independent experiments). d Significantly enriched pathways for the different modes of gene expression were identified using gene set enrichment analysis (GSEA; https://www.gsea-msigdb.org/gsea/index.jsp; NES normalised enrichment score, corrected for multiple comparisons using false discovery rate (FDR); FDR < 0.1; see also Supplementary Fig. 3 and Supplementary Data 6). GSEA plot of the KEGG oxidative phosphorylation (OXPHOS) pathway is shown. e Functional annotation enrichment analysis was performed on 579 significantly buffered genes (FDR < 0.1; Supplementary Data 5) using DAVID (https://david.ncifcrf.gov/; GO Biological Process and KEGG; P-value < 0.05; Source data and P-values are shown in Supplementary Data 7). f Single sample GSEA (ssGSEA) pathway activity plot demonstrating translational buffering of the OXPHOS pathway. Box plot indicates median (middle line), 25th and 75th percentile (box), and range (whiskers). g Distribution of mRNA encoding the indicated genes on a 10–40% sucrose gradient was determined using RT-qPCR following 1 μM Vem treatment for the indicated time (representative of n = 2 biologically independent experiments). h Total mRNA levels of the indicated genes was determined using RT-qPCR. I Whole-cell lysates were analysed by western blot for the indicated proteins following treatment with 1 μM Vem for the indicated time (representative of n = 3 biologically independent experiments; tubulin is loading control for ATP5A, UQCRC2, SDHB, NDUFB8, and β-actin is loading control for VDAC1). See also Supplementary Fig. 3. j Whole-cell lysates were analysed by western blot for the indicated proteins following treatment with 1 μM Vem for the indicated time, with or without cycloheximide (CHX; 100 μg/mL) treatment (representative of n = 3 biologically independent experiments); ATP5A is loading control for UQCRC2, SDHB and NDUFB8). See also Supplementary Fig. 3. Source data for b, e and g–j are provided as a Source Data file.

