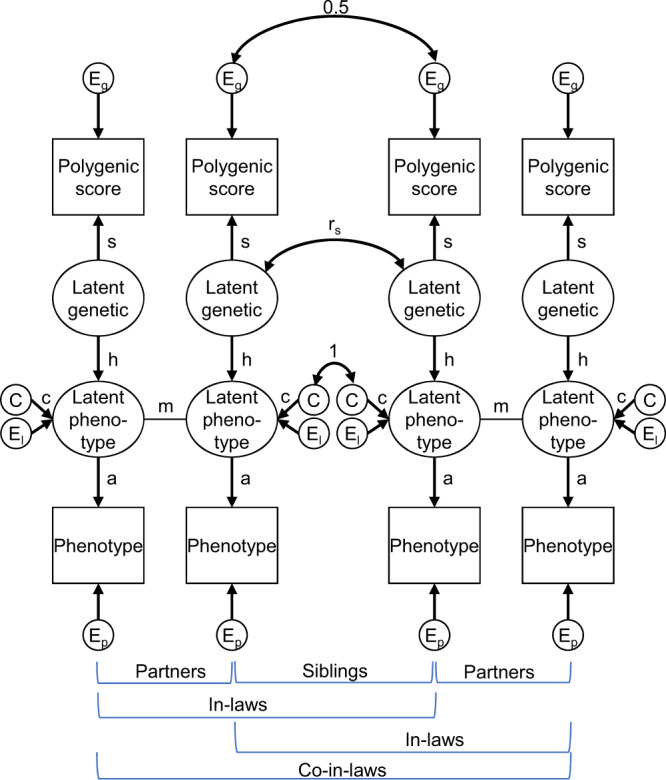
Fig. 2. The Correlation in Genetic Signal (rGenSi) model.

Triangles represent observed variables and ovals represent latent variables. Correlations in genetic signals between relatives can be estimated by following path tracing rules. h = influence of latent genetic factor on phenotype, heritability when squared; s = influence of latent genetic factor on polygenic score, genetic signal; m = partner similarity in mated phenotype; a = association between mated and measured phenotype; rs = correlation between siblings’ latent genetic factors; C = shared environmental variance; c = influences of shared environment; Eg = residual variance of polygenic score (not related to latent genetic factor); El = residual variance of latent phenotype (not related to latent genetic factor); Ep = residual variance of phenotype (not related to mated phenotype). A restricted version of the model can be estimated by constraining c to 0.00 and a to 1.00; otherwise, these can be freely estimated. Variances are fixed to 1. The residual correlation between siblings’ polygenic scores (here fixed to 0.50) can be freely estimated if influences of C are fixed to 0.00.
