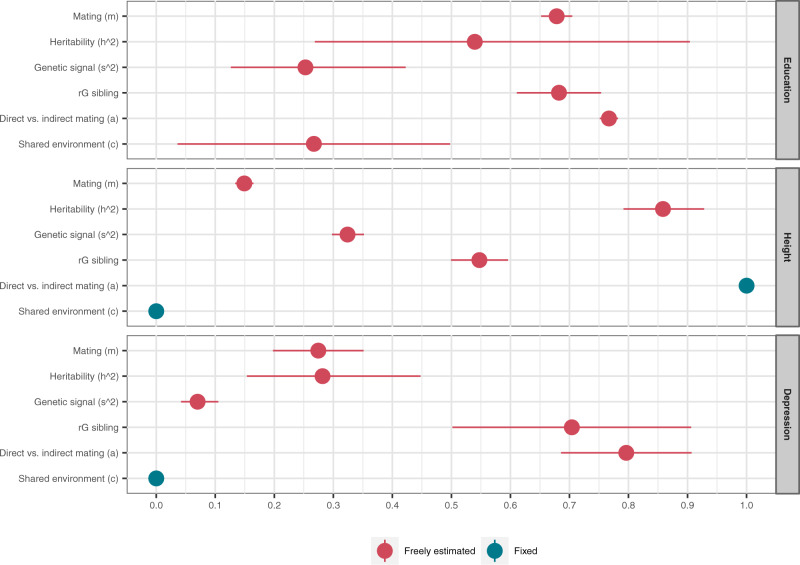
Fig. 3. Parameter estimates.
Estimates from the best fitting rGenSi models, including 95% likelihood-based confidence intervals. Values in red are freely estimated and can take any value between 0.00 and 1.00. Values in blue are fixed (a = 1 or c = 0) in the best fitting models. Exact numbers and freely estimated values for all parameters are available in Supplementary Table 6. For height and depression, there are no effects of shared environment (c = 0). For height, mating is fully based on the measured height (a = 1), whereas for education and depression, couples assort on a correlated phenotype. rG sibling = correlation between siblings’ latent genetic factors. Based on genotype data from n = 26,681 complete pairs of partners, n = 2,170 complete sibling pairs, n = 3,905 complete in-law pairs, and n = 1,763 complete co-in-law pairs, and phenotype data from n = 63,781 complete pairs of partners, n = 13,455 complete sibling pairs, n = 21,496 complete in-law pairs, and n = 8,699 complete co-in-laws pairs.

