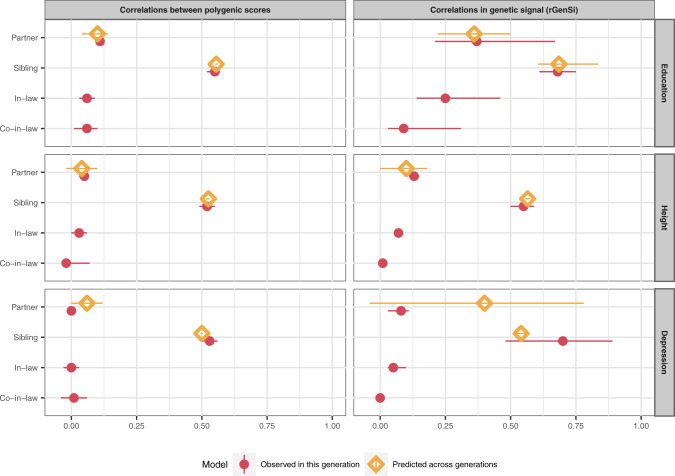
Fig. 4. Genetic resemblance between relatives.
Correlations between partners’, siblings’, in-laws’, and co-in-laws’ genetic dispositions. Correlations were estimated as Pearson’s correlations between polygenic scores (left) and as correlations between the latent genetic signals with the rGenSi model (right), including 95% likelihood-based confidence intervals. Genetic correlations from the best-fitting models. Values in red are estimated in the current generation. Values in yellow show results when partner correlations are used to predict sibling correlations and vice versa, assuming equilibrium. Predicted and observed correlations are expected to match in equilibrium. Based on genotype data from n = 26,681 complete pairs of partners, n = 2,170 complete sibling pairs, n = 3,905 complete in-law pairs, and n = 1,763 complete co-in-law pairs, and phenotype data from n = 63,781 complete pairs of partners, n = 13,455 complete sibling pairs, n = 21,496 complete in-law pairs, and n = 8,699 complete co-in-laws pairs.

