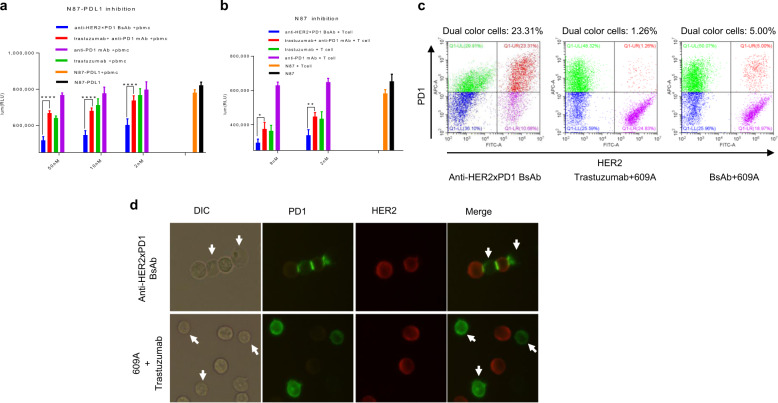
Fig. 5. The anti-HER2×PD1 BsAb exhibited synergistic killing effects on cancer cells in a PDL1 expression-independent manner ex vivo.
a Human PBMCs were mixed with PDL1-overexpressing N87 tumor cells (N87-PDL1) in the presence of 2, 10, and 50 nM indicated antibodies (the N87-PDL1/PBMC pair). b Activated Jurkat T cells were mixed with parental N87 tumor cells in the presence of 2 and 9 nM indicated antibodies (the N87/T cell pair). With respect to the combination treatment comprising trastuzumab and 609A, equal molar amounts of the two mAbs (2, 10, and 50 nM each) were combined and added to the cells. The number of viable cells was measured as relative luminescence units (RLUs). The different treatment groups were as follows: N87-PDL1 (N87), N87-PDL1 (N87) tumor cells only; N87-PDL1+PBMCs (N87+T cells), N87-PDL1 cells mixed with PBMCs (N87 cells mixed with T cells) in the absence of antibodies; Anti-PD1 mAb+PBMCs (Anti-PD1 mAb+T cells), N87-PDL1 cells mixed with PBMCs (N87 cells mixed with T cells), and the anti-PD1 mAb, 609A; Trastuzumab+PBMCs (Trastuzumab+T cells), N87-PDL1 cells mixed with PBMCs (N87 cells mixed with T cells) and trastuzumab; Trastuzumab+anti-PD1 mAb+PBMCs (Trastuzumab+anti-PD1 mAb+T cells), combination of trastuzumab and 609A added to N87-PDL1 cells in the presence of PBMCs (N87 cells in the presence of T cells); and Anti-HER2×PD1 BsAb+PBMCs (Anti-HER2×PD1 BsAb+T cells), the BsAb added to N87-PDL1 in the presence of PBMCs (N87 cells in the presence of T cells). *P < 0.05, **P < 0.01, and ****P < 0.0001 by two-way ANOVA. c PD1-overexpressing Jurkat T cells prelabeled with an Alexa Fluor 647-conjugated anti-PD1 mAb (Sinobiological, Cat#MM18) were mixed with N87 cells prelabelled with an Alexa Fluor 546-conjugated anti-HER2 mAb (19H6-Hu) in the presence of the BsAb (left), the mixture of trastuzumab and 609A (center), the BsAb plus 609A (right). The group in red (pseudo-color) (upper right corner) shows cells that have dual emission signals (MFI > 1 × 10⁴ for FITC-A and MFI > 3 × 10⁴ for APC-A), meaning that the two types of cells were associated together. The group in green (pseudo-color) (upper left corner) shows T cells labeled with the Alexa Fluor 647-conjugated anti-PD1 mAb (MFI > 3 × 10⁴ for APC-A). The group in purple (pseudo-color) (lower right corner) shows N87 cells labeled with the Alexa Fluor 546-conjugated anti-HER2 mAb (MFI > 1 × 10⁴ for FITC-A). d Immunofluorescence microscopy showing costaining of PD1 (green) on T cells and HER2 (red) on N87 tumor cells in samples treated with the BsAb or a mixture of the anti-PD1 mAb (609A) plus trastuzumab. Note that one tumor cell was ligated with two T cells, while a single T cell was in contact with two tumor cells in the presence of the BsAb. The combination of 609A and trastuzumab failed to induce PD1 synapse formation with T cells. The white arrows denote T cells (DIC channel), for which PD1 staining (green channel) were barely seen owing to the rearrangement of PD1 during synapse formation.

