Fig. 2.
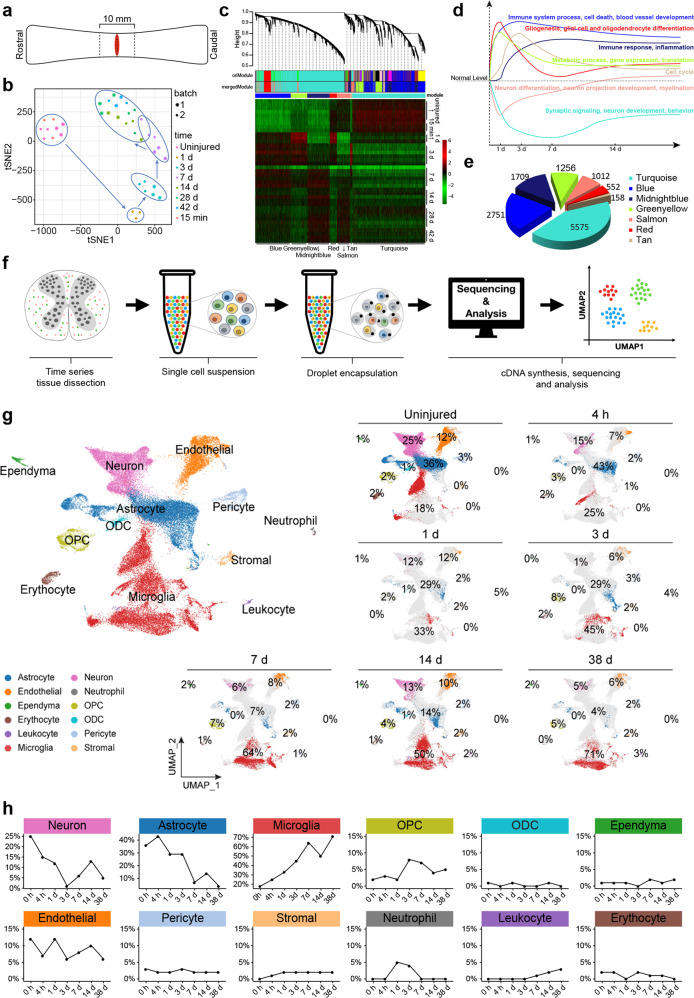
Temporal population-based (bulk-RNA-seq) and scRNA-seq uncovered transcriptomic changes post-SCI. a Schematic illustration of tissue sampling for bulk-RNA-seq and scRNA-seq. b The t-SNE plot visualizes 39 samples from 2 bathes, demonstrating consistent sequencing results from 2 batches. c Hierarchical clustering dendrogram of 39 samples shows coexpression modules identified using WGCNA. Seven modules were detected post 0.25 threshold merge. An expression heatmap of each module across all samples is demonstrated. d GO terms of 7 gene modules and their averaged gene expression temporal changes of post-SCI. e Pie-chart demonstrating gene counts of each module. f Summary of 10× Genomics scRNA-seq experimental workflow. g UMAP visualization plot of 59,558 spinal cord cells sequenced from all samples, color-coding defined 12 major cell types based on signature gene expression. The panels on the right show the proportion of each cell type at each time point before and post SCI. h Line charts demonstrating temporal changes of the relative contents of the 12 major cell types detected through scRNA-seq

