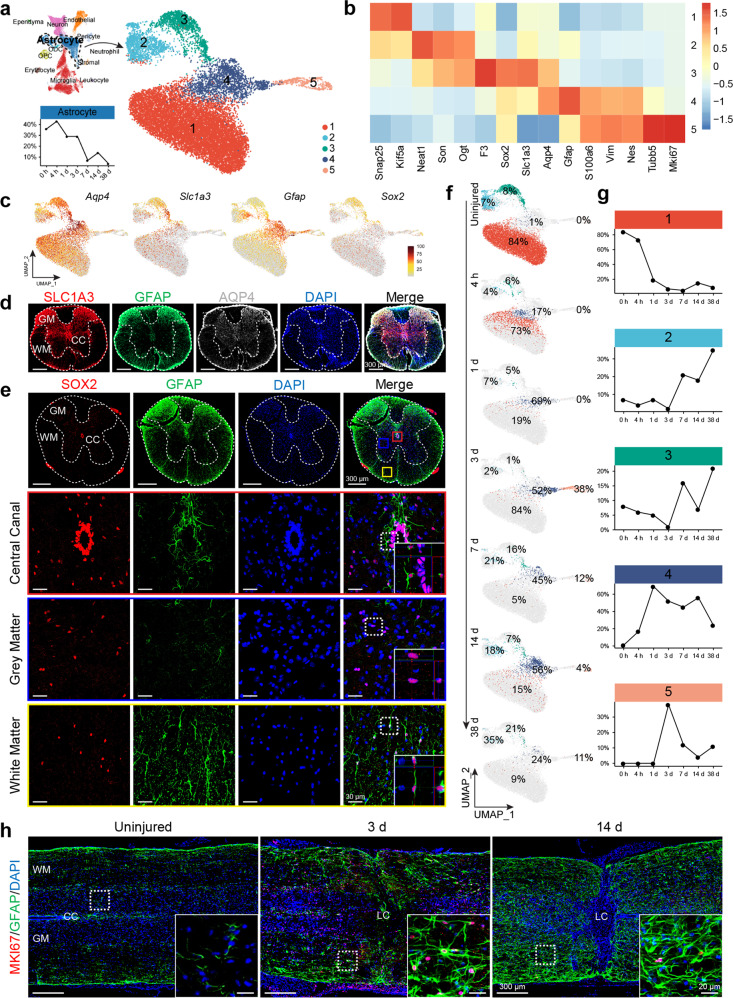
Fig. 4.
Diverse astrocytic subpopulations converged post-SCI. a UMAP visualization plot showing 5 astrocyte clusters (subtypes). b Heatmap of normalized mean expression of signature genes for each astrocytic cluster. c Feature plots showing gene expression of Aqp4, Slc1a3, Gfap, and Sox2 in different astrocyte clusters. d Immunofluorescent staining of uninjured spinal cord tissue with antibodies against SLC1A3, GFAP, and AQP4. e Immunofluorescent staining of uninjured spinal cord tissue with GFAP and SOX2, showing that SOX2 positive cells were concentrated surrounding the central canal, and also sporadically in gray and white matters; in the white matter, all SOX2 positive cells were also positive for GFAP, whereas in the gray matter only some SOX2 positive cell were GFAP positive. SOX2 positive cells lining the central canal were GFAP negative. f UMAP plots indicating temporal changes of spinal cord astrocyte clusters (subtypes). g Line charts demonstrating temporal changes of the relative contents of the five major spinal cord astrocyte clusters. h Immunofluorescent staining of spinal cord tissue 3 days post-injury with Gfap and cell proliferation marker Mki67

