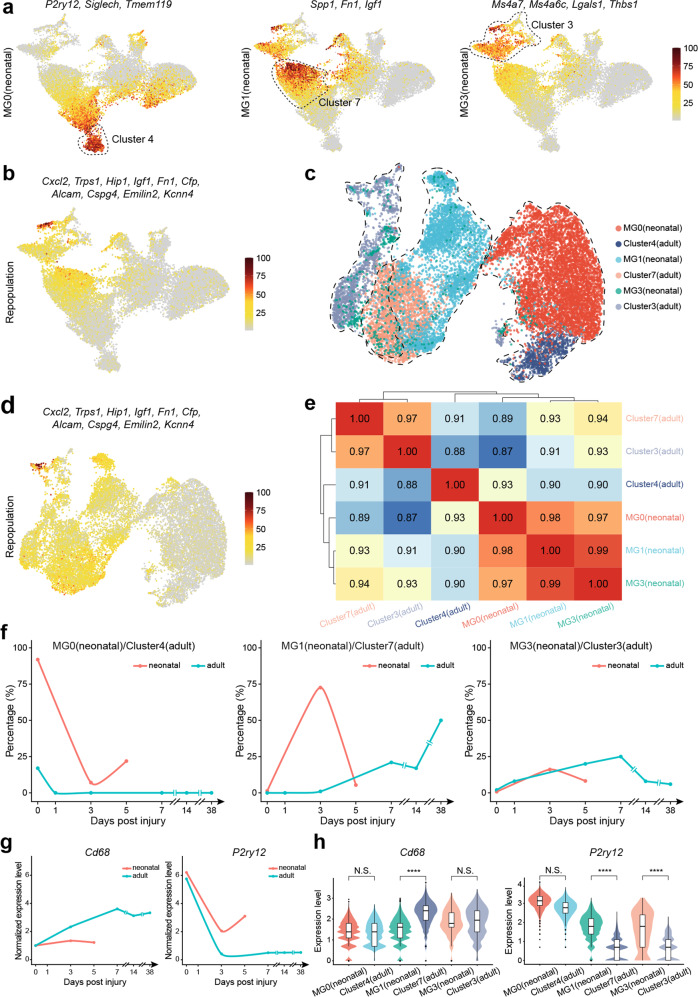
Fig. 6.
Presence of regeneration-promoting microglia in the adult spinal cord. a Feature plot showing average expression of different groups (MG 0/1/3) of neonatal microglia signature genes in different adult spinal cord microglia clusters. b Feature plots showing average expression of repopulation microglia signature genes in adult spinal cord microglia clusters. c UMAP visualization plot showing neonatal microglia MG 0/1/3 and adult spinal cord microglia cluster 4/7/3 merged correspondingly, in a subtype-specific manner. d Feature plots showing average expression of repopulation microglia signature genes in MG 0/1/3 (neonatal) and cluster 3/4/7 (adult). e Clustering heatmap based on Pearson’s correlation coefficient between MG 0/1/3 (neonatal) and cluster 3/4/7(adult), showing similarity between corresponding neonatal and adult microglia subtypes were 0.93, across all three subtypes. f Line chart showing temporal changes in relative contents of MG 0 (neonatal)/cluster 4 (adult), MG 1 (neonatal)/cluster 7 (adult), and MG 3 (neonatal)/cluster 3 (adult). g Temporal gene expression changes of Cd68 and P2ry12 in neonatal and adult spinal cord post-injury. h Violin plots showing Cd68 and P2ry12 expression levels in MG 0 (neonatal)/cluster 4 (adult), MG 1 (neonatal)/cluster 7 (adult), and MG 3 (neonatal)/cluster 3 (adult) (****P < 0.0001; N.S., not significant)

