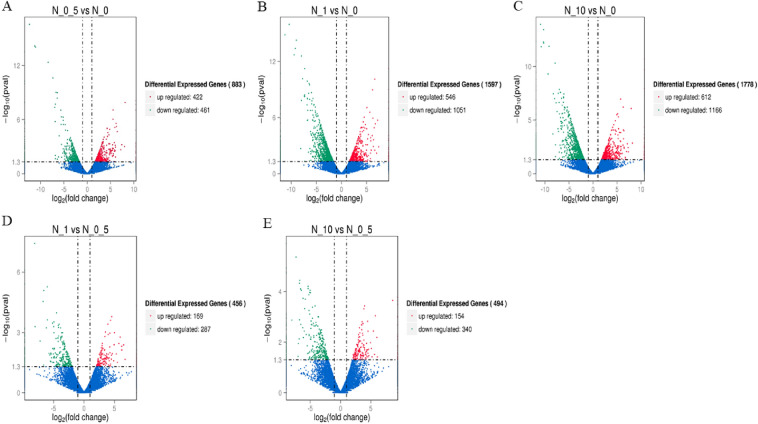
Figure 4.
Volcano plot of the differentially expressed genes (DEGs). (A–C) represent DEGs among three treatment groups (N0.5, N1 and N10), with treatment N0 as a control. (D,E) represent DEGs among two treatments (N1 and N10), with treatment N0.5 as a control. Genes with significant differential expression are represented by red dots (upregulated) and green dots (downregulated), while genes without significant differential expression are represented by blue dots. The abscissa represents the multiple changes in gene expression in different samples. The ordinate represents the statistical significance of the difference in gene expression.

