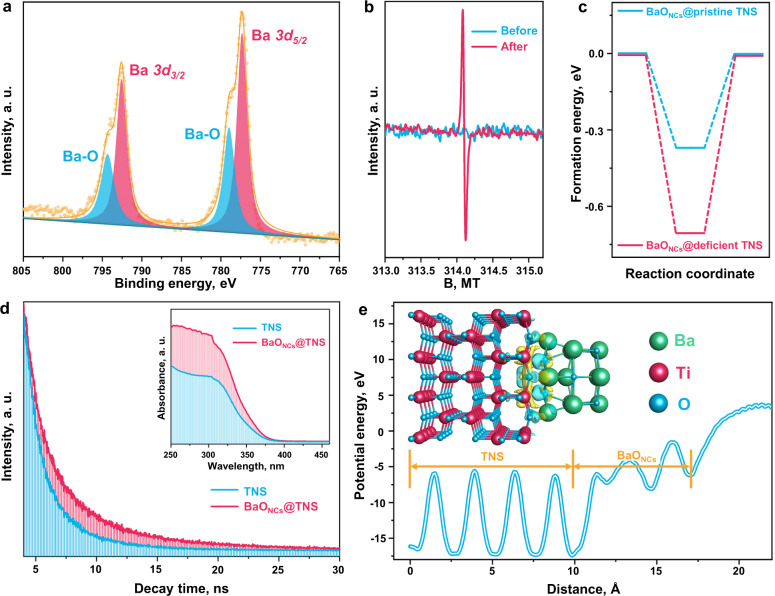
Fig. 2. Chemical composition and electronic structure.
a Ba 3d X-ray photoelectron spectroscopy (XPS) spectra of BaONCs-TNS. b Room temperature solid electron paramagnetic resonance (EPR) results of TNS before and after irradiation for 30 min. c Calculated binding energy of BaONCs deposited at pristine and deficient TNS surfaces respectively. d Time-resolved fluorescence emission decay spectra. Inset: UV–vis diffuse reflection spectra (DRS) results. e Calculated planer average potential energy profile using Perdew-Burke-Ernzerhof (PBE) + U correction. Inset: calculated charge difference distribution at the BaONCs/TNS interface, in which charge accumulation is marked in blue and charge depletion is marked in yellow. The isosurfaces were set to 0.005 eV Å−3.

