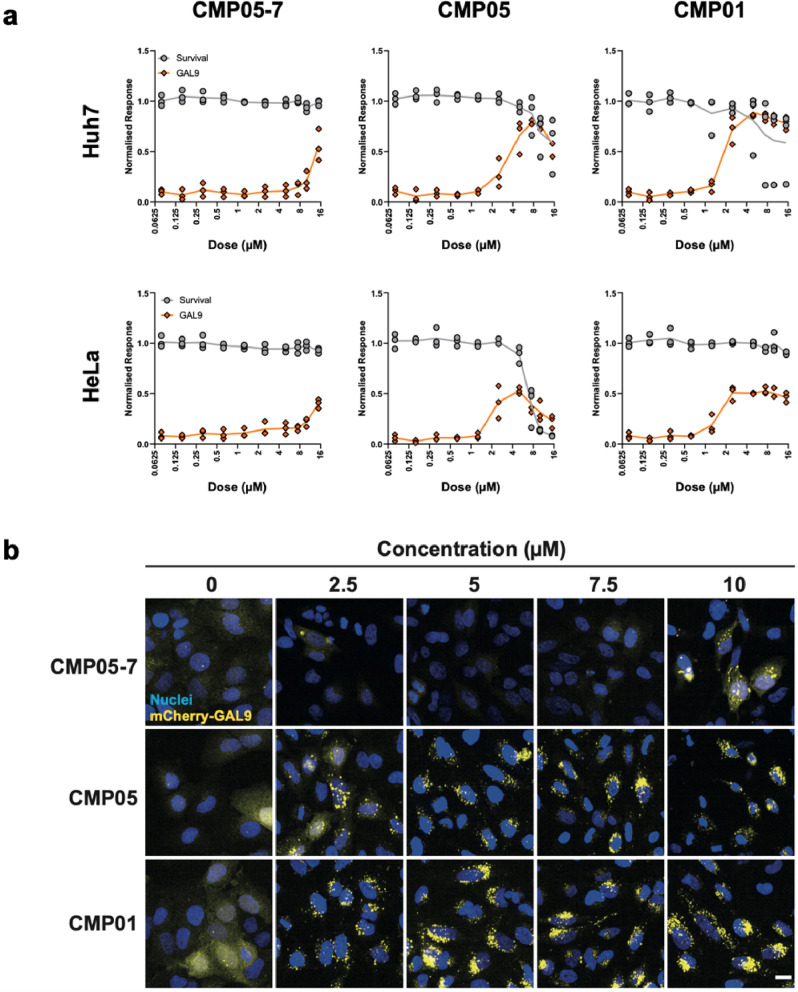
Fig. 2. Screening endosomolytic compounds for Gal9-related endosomal rupture.
a HeLa_mCherry-Gal9 cells were treated with compound across 10-point dose titration series for 2 h and then stained for nuclei (Hoechst 33342, blue), fixed, and imaged. Representative images display the translocation of Gal9 (yellow) from cytosolic to punctate in a dose-dependent manner. Scale bar = 20 µm. b Image analysis reveals the narrow window in concentration between induction of endosomal rupture and cytotoxicity. Gal9 punctate (orange) reported as a percentage of max quantitation, normalized to nuclei signal. Cell survival (gray) reported as a percentage of all cells normalized to a DMSO control. HuH7 images are shown in Supplementary Fig. 1.

