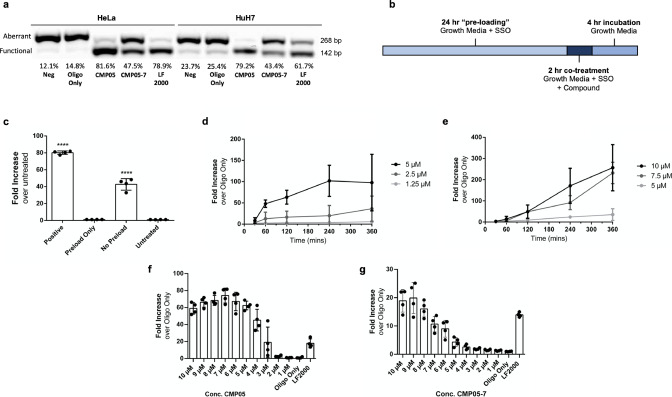
Fig. 3. Characterization of endosomolytic compound dose and time-dependent effects.
a Representative RT-PCR with gel analysis used to detect aberrant or functional mRNA copies. Gel images were quantitated using Quantity One (BioRad) software. Values of functional mRNA are reported as a percentage of total mRNA. b Schematic of the treatment plan. Cells are seeded in DMEM + 10% FBS (growth media) with added SSO. After 24 h, endosomolytic compound diluted in growth media is added to the desired final concentration. After 2 h of co-treatment, media is removed, cells are washed with PBS, and then replaced in growth media for 4 h. Media is then removed and cells are lysed in accordance with the next experimental steps. c Functional SSO activity from different treatment plans of CMP05. The “positive” group underwent the previously described treatment. The”preload only” group was treated with 1 µM SSO for 24 h and then media was changed to growth media with 5 µM compound for 2 h. The”no-preload” group was treated with 1 µM SSO and 5 µM CMP05 simultaneously for 2 h. Values are reported as fold increase over untreated cells. The “Positive” and “No Preload” groups are each significantly higher than the “Untreated” and “Preload Only” groups (P < 0.001). Data come from n = 4 experiments. d, e HeLa_Luc705 cells were co-treated with 1 µM SSO and various concentrations of CMP05 (d) or CMP05-7 (e). Co-treatment duration lasted 30 min, 1 h, 2 h, 4 h, or 6 h followed by the same 4-h incubation step. Values are reported as fold increase over SSO only. Data come from minimum of n = 3 experiments (d) and n = 3 experiments (e). f, g HeLa_Luc705 cells were co-treated with 1 µM SSO and various concentrations of CMP05 (f) or CMP05-7 (g). Co-treatment duration lasted 2 h, followed by a 4-h incubation step. Data comes from n = 4 experiments. Intraexperimental variability can contribute to discrepancies in fold increase between experiments.

