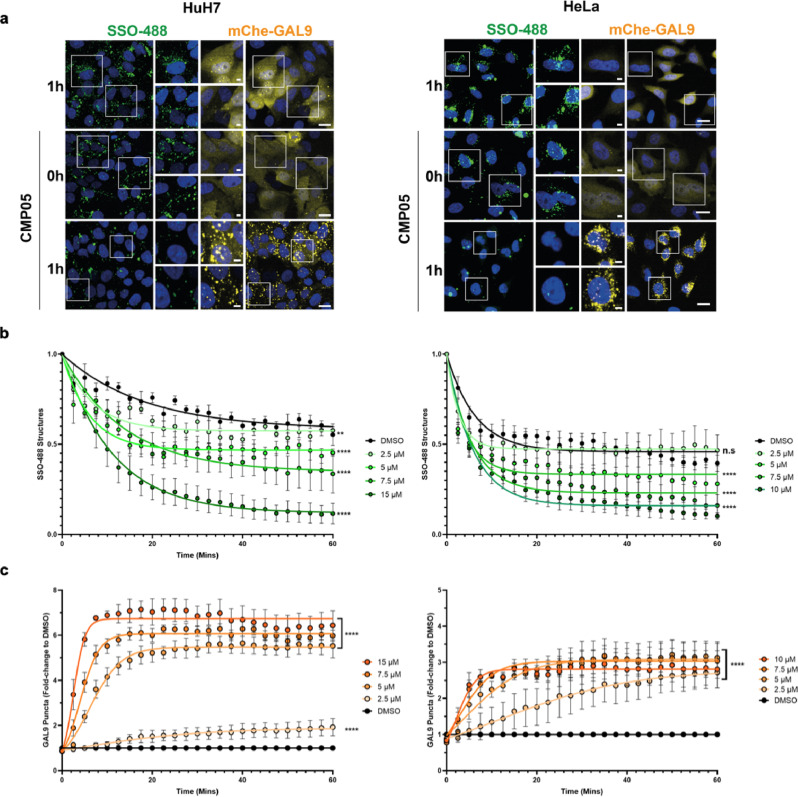
Fig. 6. Live-cell mCherry-Gal9 assay with SSO-488 in HuH7 and HeLa cells.
a Live-cell confocal microscopy reveals a simultaneous decrease of SSO-containing bodies and Gal9 translocation. HuH7_mCherry-Gal9 and HeLa_mCherry-Gal9 were pre-loaded with SSO-488 (green) for 24 h and then treated with various concentrations of CMP05 and Hoechst to visualize nuclei (blue). Gal9 events appear as yellow puncta. Scale bars = 20 µm (larger panels) and 5 µm (insets). White boxes indicate inset regions. b Quantitative analysis of cells treated as in a and imaged every 2.5 min. Analysis reveals a time and dose-dependent decrease in the total number of SSO-488 structures per cell. Data represent mean −/+ SEM from n = 3 independent experiments. c Cells treated as in (b) and quantitation of mCherry-Gal9 puncta formation. Analysis displays a dose and time-dependent increase of Gal9 structures per cell. Data represent mean −/+ SEM from n = 3 independent experiments. Significance was determined by two-way ANOVA followed by Dunnett’s posttest to the DMSO control where ****P < 0.0001 and n.s = not significant.

