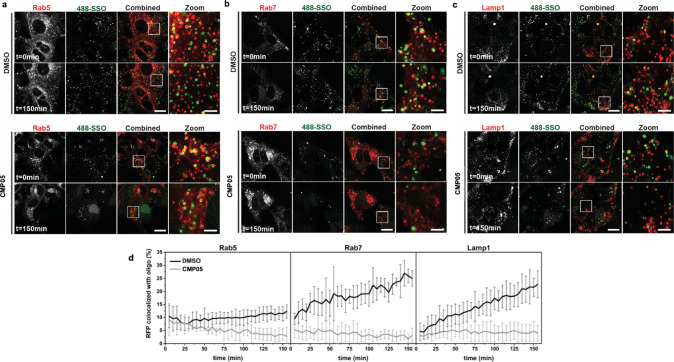
Fig. 7. Live-cell confocal microscopy images of SSO-endosome colocalization assay.
a–c Live-cell microscopy of HuH7 cells overexpressing mRFP-Rab5 (a), mRFP-Rab7 (b) or Lamp1-RFP (c) after 15 min pulse-incubation with 1 µM SSO and 2.5 µM CMP05. The cells were continuously exposed to 2.5 µM CMP05 and imaged over time. The images were analyzed for colocalization between 488-SSO and (m)RFP by the ComDet plugin to ImageJ and detected particles are marked with a circle (green for 488-SSO, red for (m)RFP and yellow for colocalized particles). Scale bars are 20 µm in the full images and 5 µm in the zoomed images. d Quantitation of (m)RFP colocalized with 488-SSO using the ComDet plugin. The data are presented as the percentage of detected (m)RFP-positive vesicles colocalized with SSO-positive vesicles ± SD (CMP05: Rab5 n = 4, Rab7 n = 4, Lamp1 n = 5; DMSO: all cell lines n = 6).

