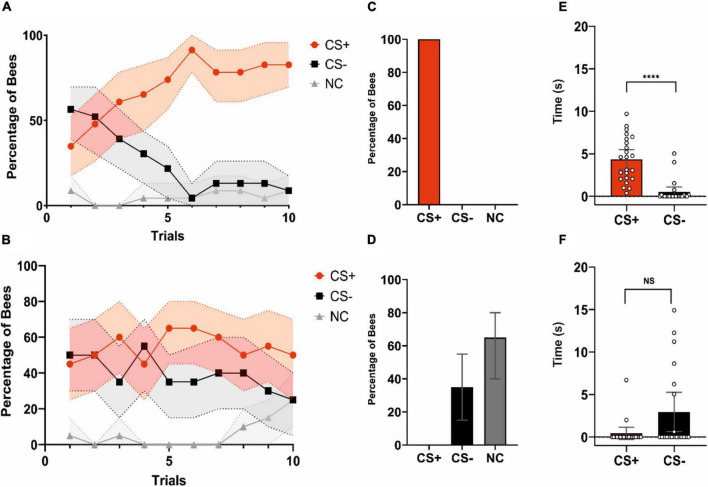
FIGURE 2.
Acquisition and test performances of learners and non-learners. (A) Acquisition performance of learners (i.e., bees that chose the CS + in the non-reinforced test; n = 23). The red, black and gray curves show the percentages of bees choosing the CS +, CS–, or not making a choice (NC), respectively. Bees learned the discrimination between CS + and CS–. (B) Acquisition performance of non-learners (i.e., bees that chose the CS– or did not make a choice in the non-reinforced test; n = 17). These bees did not learn to discriminate the CS + from the CS–. (A,B) Shaded areas around curves indicate the 95% confidence interval. (C) Test performance of learners (% of bees choosing either the CS +, the CS– or not making a choice). Per definition these bees only chose the CS + first. (D) Test performance of non-learners. (% of bees choosing either the CS+, the CS– or not making a choice). Per definition these bees chose either the CS– or did not make a choice (NC). (C,D) Error bars represent the 95% confidence interval. (E) Time (s) spent by learners fixating the CS + and the CS– during the test. Learners spent more time fixating the CS + consistently with their stimulus choice. Bars represent the time spent keeping the object within –12.5°/ + 12.5° in front of the bee. Scatter plots represent individual fixation times, ****p < 0.0001. (F) Time (s) spent by non-learners fixating the CS + and the CS– during the test. Non-learners did not differ in their fixation time of the CS + and the CS–. Bars represent the time spent keeping the object within –12.5°/ + 12.5° in front of the bee. Scatter plots represent individual fixation times. NS, non-significant. (E,F) Error bars represent the 95% confidence interval.

