FIGURE 3.
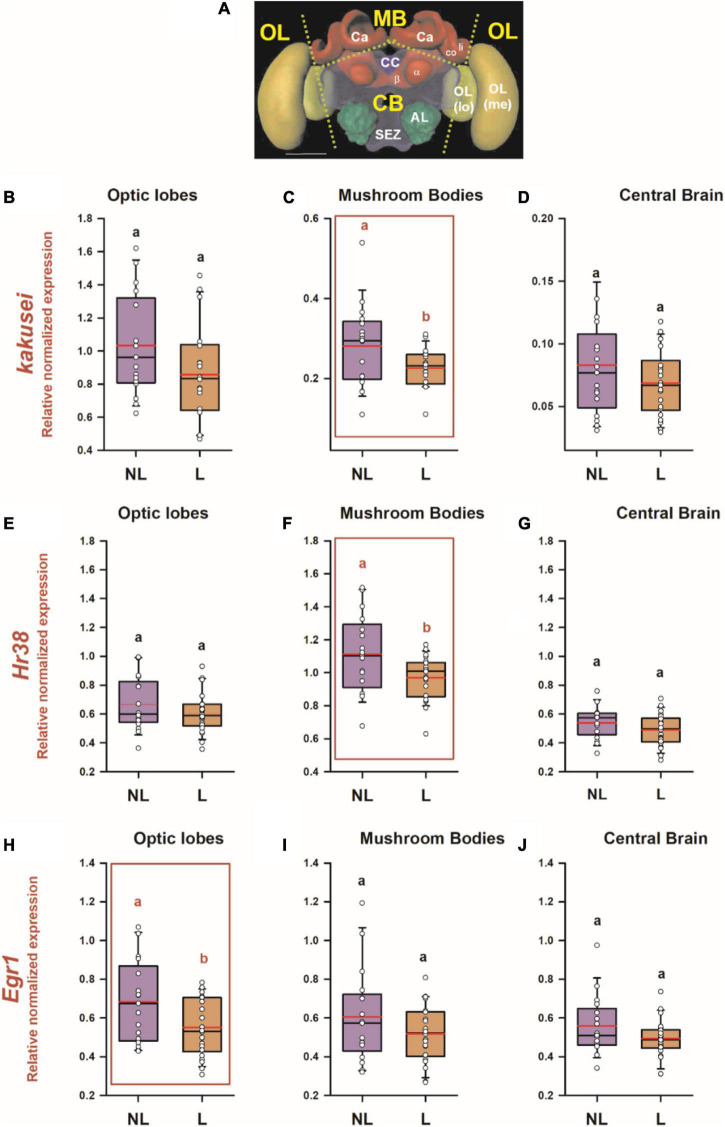
Differential IEG expression as a consequence of associative color learning in a 2D VR environment. (A) Honey bee brain with sections used for quantifying IEG expression. Yellow labels indicate the brain regions used for the analysis: MB, mushroom body; CB, central brain; OL, optic lobes. The dashed lines indicate the sections performed. Ca, calyx of the mushroom body; li, lip; co, collar; a and b, a and b lobes of the mushroom body; CC, central complex; AL, antennal lobe; SEZ, suboesophagic zone; OL, optic lobe; Me, medulla; lo, lobula. Relative normalized expression of panels (B–D) kakusei, (E–G) Hr38, and (H–J) Egr1 in three main regions of the bee brain, optic lobes (B,E,H), calyces of the mushroom bodies (C,F,I), and central brain (D,G,J). The expression of each IEG was normalized to the geometric mean of Actin and Ef1a (reference genes). IEG expression was analyzed in individual brains of bees belonging to two categories: learners (L: conditioned bees that responded correctly and chose the CS+ in their first choice during the non-reinforced test) and non-learners (NL: conditioned bees that did not choose the CS + in their first choice during the non-reinforced test). The range of ordinates was varied between panels to facilitate appreciation of data scatter. In all panels, n = 22 for learners and n = 17 for non-learners. Different letters on top of box plots indicate significate differences (two-sample t test; p < 0.05). Box plots show the mean value in red. Error bars define the 10th and 90th percentiles. Red boxes indicate cases in which significant variations were detected.

