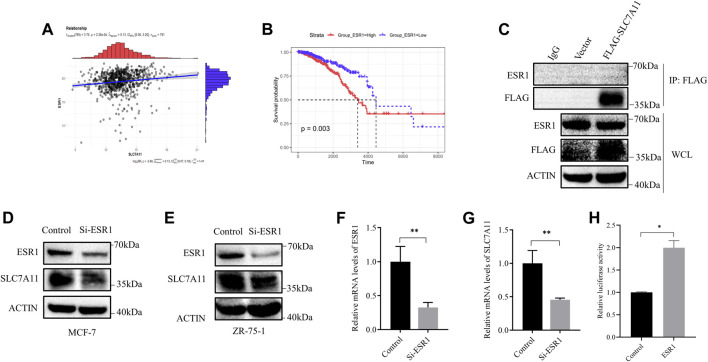
FIGURE 3.
Correlation between ESR1 and SLC7A11 in ER-positive cancers. (A) Scatter plots for correlation analysis of ESR1 and SLC7A11. The dark gray line means a linear regression line and the gray region is 95% confidence region. (B) Kaplan–Meier curve of OS in ER-positive cancers according to ESR1 expression. (C) IP assay of MCF-7 cells transfected with a plasmid expressing FLAG-tagged SLC7A11. (D–G) Western blot and qRT-PCR analysis showed that si-ESR1 reduced SLC7A11 expression in MCF-7 (D,F,G) and ZR-75-1 (E). (H) Effect of ESR1 on SLC7A11 transcription by double fluorescein-reporter enzyme activity in MCF-7. Shown is mean ± SD, n ≥ 3, *p < 0.05; **p < 0.01.

