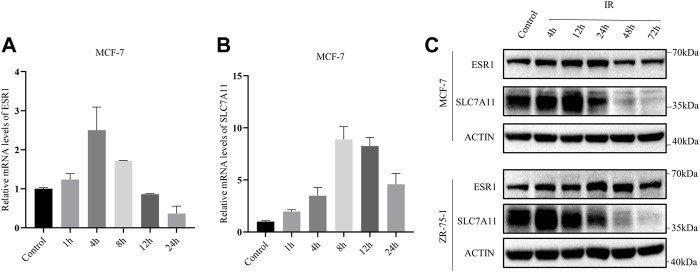
FIGURE 4.
IR-induced SLC7A11 and ESR1 expression in ER-positive cell lines. Cells were collected at different time points after IR with 8 Gy x-rays. Western blot, and qRT-PCR were used to detect the expression of SLC7A11 and ESR1. (A,B) Relative mRNA expression of ESR1 (A) and SLC7A11 (B) were detected in MCF-7. Shown is mean ± SD. (C) SLC7A11 and ESR1 protein expression by IR treated in MCF-7 and ZR-75-1.

