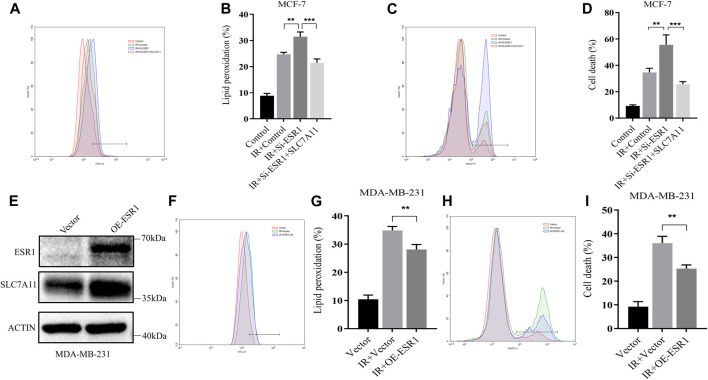
FIGURE 6.
Characterization of rescue cells and ESR1 overexpression. (A–D) MCF-7 cells were co-transfected with Si-ESR1 and pcDNA3.1-SLC7A11 for 48 h, then treated with IR (8 Gy). (E) Western blotting analysis of ESR1 overexpression in MDA-MB-231. (A–D, F–I) Lipid peroxidation and cell death were assessed by flow cytometry using C11-BODIPY and trypan blue, respectively. Shown is mean ± SD, n ≥ 3, **p < 0.01; ***p < 0.001.

