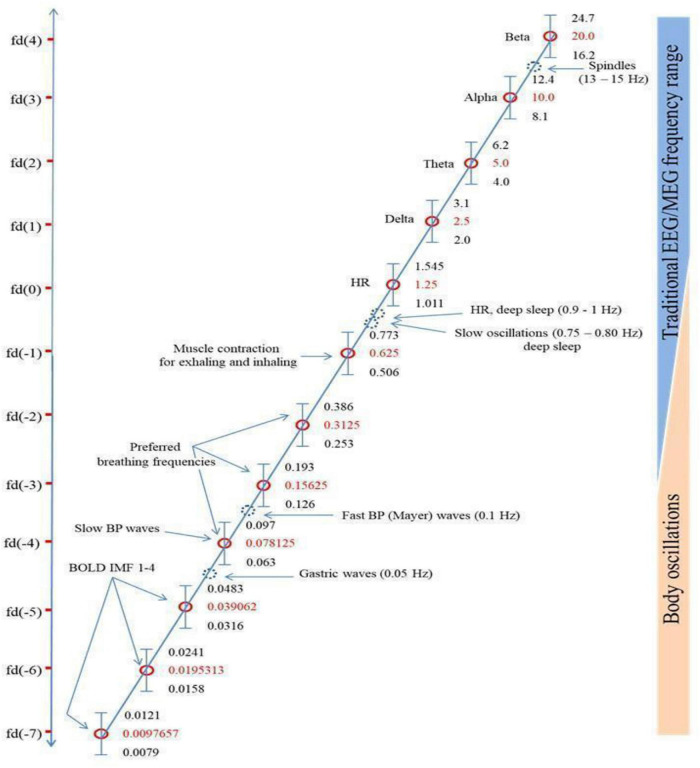
FIGURE 1.
Klimesch’s (2018) figure illustrating the Binary Hierarchy Brain Body Oscillation Theory frequency architecture. Frequency bands, calculated according to the “golden mean rule” (see Klimesch, 2018), are depicted as vertical bars (bandwidths relative to the y-axis are not to scale). Frequencies lying outside the predicted bands are represented as dashed blue circles and are considered falling outside the binary hierarchy.

