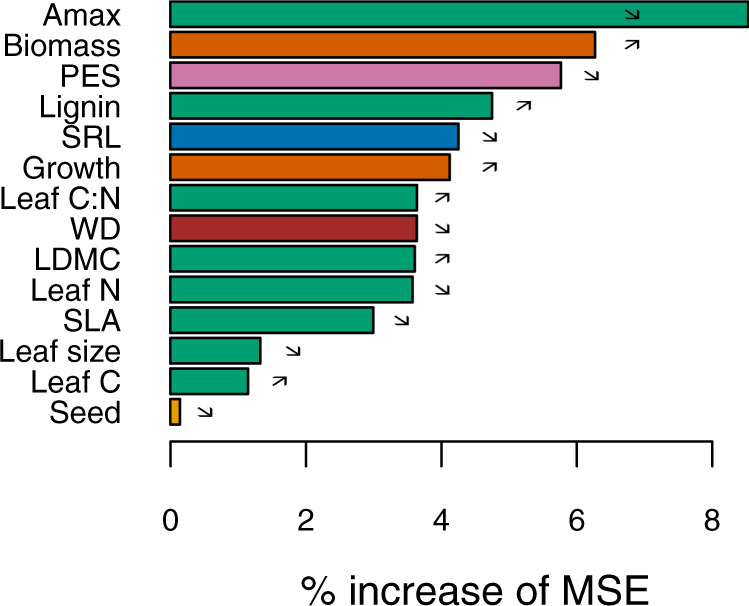
Fig. 1. Main variables explaining the SOC pools at the local scale.

The SOC pool was modelled using relative values, normalised to site conditions. The predictors were: (i) leaf traits, in green: maximum photosynthetic capacity (Amax), C content, N content, C:N ratio, lignin content, leaf dry matter content (LDMC), leaf size and specific leaf area (SLA); (ii) other plant traits [seed mass (in yellow), wood density (WD; in brown), specific root length (SRL; in blue)]; (iii) the index score of the Plant Economics Spectrum (PES; in violet); and (iv) stand biomass dynamics, in dark orange (standing biomass; tree species growth). The influence of the variables was assessed using the percentage of increase of MSE from the Random Forest approach (see “Methods”). Arrows indicate positive (↗) or negative (↘) effects of the predictors on SOC. Source data are provided as a Source Data files.
