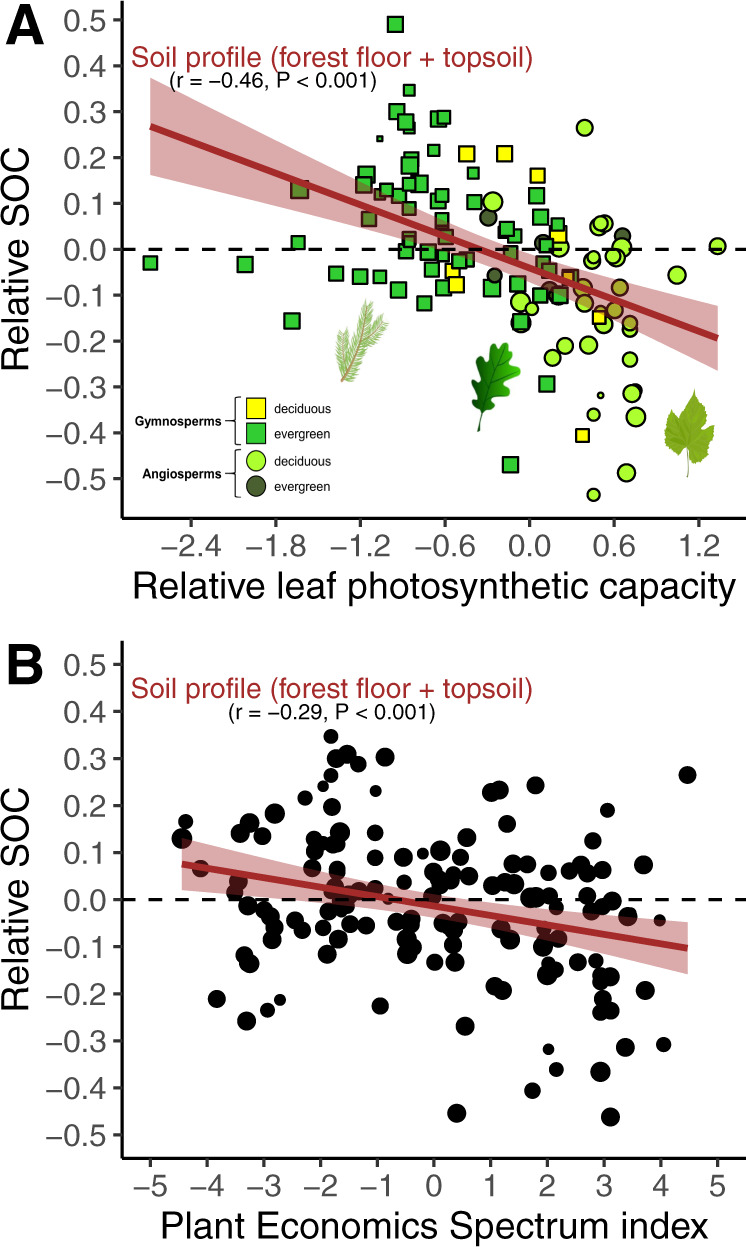
Fig. 2. Global influence of plant functional traits on SOC pool.

Relationship between photosynthetic capacity of tree species (Amax) and SOC pool (A); relationship between the index score of the Plant Economics Spectrum (PES) and SOC pool (B). Values are normalised and the symbol size is proportional to data reliability (see “Methods”), which was taken into account as a weighting factor in the regression. A linear regression was fitted (level of confidence of the error band = 0.95). Source data are provided as a Source Data files.
