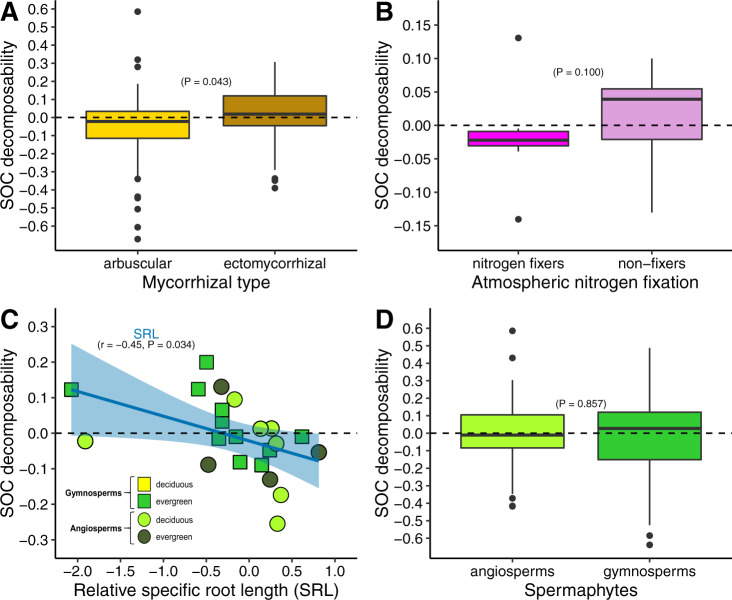
Fig. 3. SOC decomposability as a function of plant functional types and specific root length.
The values show the SOC decomposability, which is the opposite of SOC stability. Values are normalised (see “Methods”). Number of values: n = 49 & 52 (arbuscular versus ectomycorrhizal), n = 8 & 14 (fixers versus non-fixers), n = 28 & 31 (angiosperms versus gymnosperms). A, B, D: boxplots represent the median, the first and third quartiles, and 1.5× the inter-quartile range; significant differences tested with pairwise t test or Wilcoxon test (two-sided), depending on data structure. C a linear regression was fitted (level of confidence of the error band = 0.95). Source data are provided as a Source Data files.

