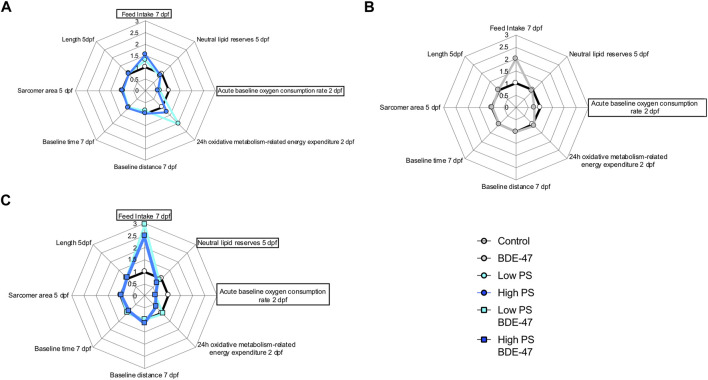
FIGURE 10.
Radar chart diagrams summarizing organismal level effects of different exposure treatments on the metabolic phenotype in developing zebrafish: Control, 2.5 ppm PS and 25 ppm PS exposures (A) Control and 10 ppt BDE-47 exposure, (B) Control and combined exposures of 2.5 ppm + 10 ppt BDE-47 and 25 ppm + 10 ppt BDE-47, (C) in comparison to vehicle control. Note that all average treatment group values have been normalized to control values (=1) and in some cases inverted so that datapoints >1 indicate quantified parameters with a positive contribution to energy balance, while datapoints <1 indicate parameters negatively contributing to organismal energy balance. Endpoints with significant effects of treatment are highlighted by surrounding rectangular shapes.

