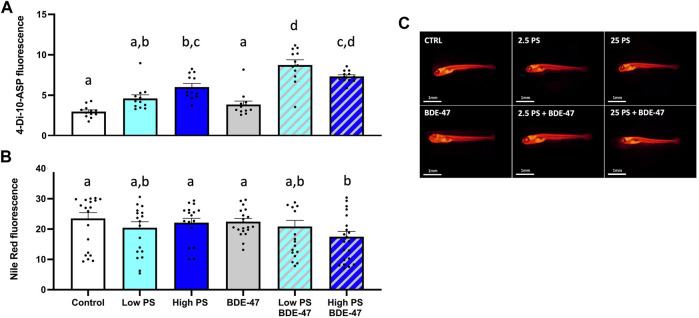
FIGURE 4.
Feed-intake (A) and neutral lipid deposition (B) of 7 dpf zebrafish larvae exposed to vehicle control, 2.5 ppm PS, 25 ppm PS, 10 ppt BDE-47 or their combinations. Individual measurements and average data +S.E.M. from n = 3 replicate assays with a combined n = 12 (A) and n = 18–22 (B) per treatment group are presented. Representative images of Nile Red based neutral lipid staining are shown (C). Data were analyzed using a one-way ANOVA with a significance cut-off of p < 0.05. Different letters indicate significant differences between groups as analyzed by Tukey’s post-hoc test.

