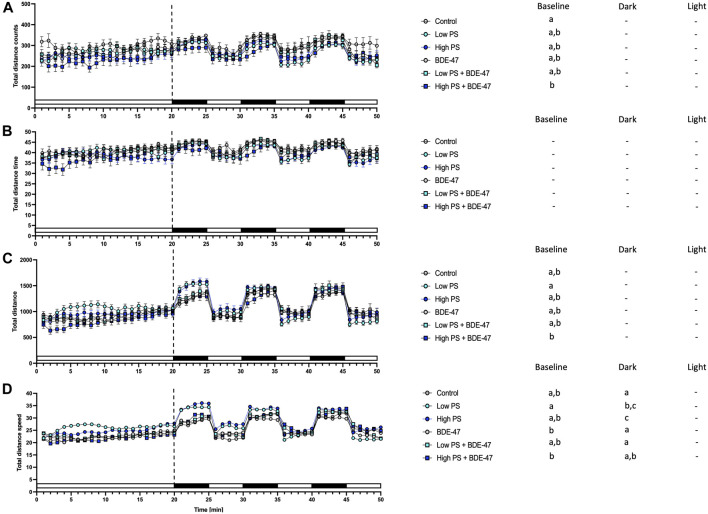
FIGURE 6.
Total movement parameters from 7 dpf zebrafish larvae locomotion assays (n = 3) with a total n = 48 per treatment group consisting of exposures to vehicle control, 2.5 ppm PS, 25 ppm PS, 10 ppt BDE-47 or their combinations. All measurements over the 50 min assays were binned in 1 min units, with 20 min baseline followed by 3 cycles of 5 min dark light alterations. Average total counts of movement events +/− S.E.M. (A), average duration of total movement events +/− S.E.M in s (B), Distance of total movement events +/− S.E.M in mm (C), Average speed +/− S.E.M of total movements in mm/s (D). Data were analyzed using separate one-way repeated measurement ANOVAs for baseline, dark, and light conditions. Significant treatment effects (p < 0.05) are shown in Table 2, and specific post-hoc analysis results are depicted next to the graphs for all parameters. Different letters indicate significant differences between groups as analyzed by Tukey’s post-hoc test (p < 0.05).

