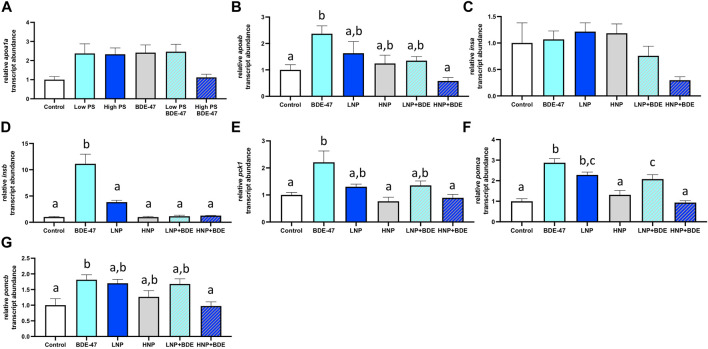
FIGURE 9.
Relative abundance of mRNA transcripts with characterized roles in energy metabolism in whole 7 dpf larvae. Treatment groups consist of exposures to vehicle control, 2.5 ppm PS, 25 ppm PS, 10 ppt BDE-47 or their combinations. Apolipoprotein transcripts apoa1a (A) and apoab (B), insulin paralogue transcripts insa (C) and insb (D), the gluconeogenic marker pck1 (E) and pomc paralogues pomca (F) and pomcb (G). Average mRNA transcript abundance +S.E.M. of n = 4 pooled replicates per treatment group containing n = 10 larvae per replicate are shown. Relative transcript abundance was normalized to control group to reflect fold-change. All data was analyzed using one-way ANOVAs with a significance cut-off of p < 0.05. Where omnibus tests revealed a significant treatment effect, Tukey’s post-hoc test (p < 0.05) was used to discern significant differences between treatment groups, which are indicated by different letters.

