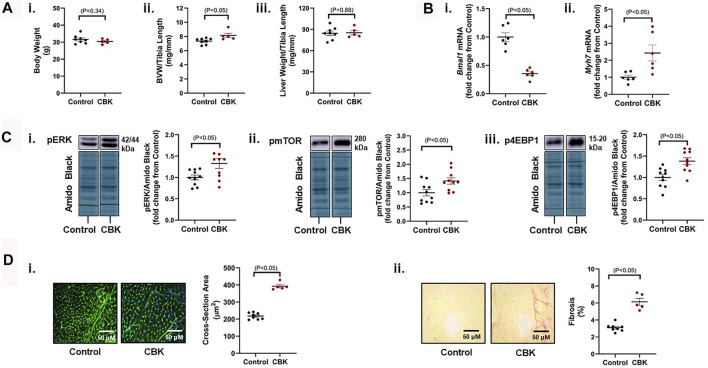
FIGURE 1.
Phenotypic differences between 16 week old CBK and littermate control mice at the levels of gravimetric, gene expression, signaling, and histologic levels. (A) Body weight (i), biventricular weight to tibia length ratio (BVW/TL; ii), and liver weight to tibia length ratio (iii) (n = 5–8). (B) Cardiac Bmal1 (i) and Myh7 (ii) mRNA levels (n = 6). (C) p-ERK 1/2Thr202/Tyr204 (i), p-mTORSer−2448 (ii), and p-4EBP1Thr−37/46 (iii) protein levels (n = 10). (D) Cardiomyocyte size (i) and interstitial fibrosis (ii) (n = 5–8). Data/samples were collected at ZT20. All data are reported as mean ± SEM.

