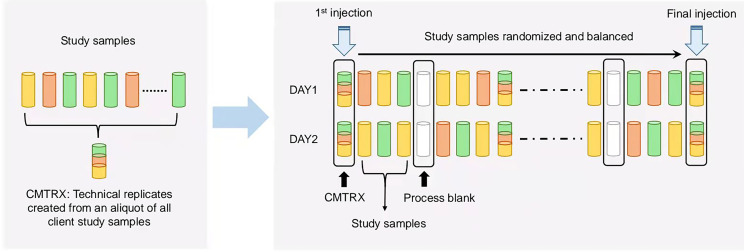
Figure 1.
Technical flowchart of sample preparation for mass spectrometry analysis. A small aliquot of each study sample (colored cylinders) was pooled to create a replicate sample (multicolored cylinder), which was then injected periodically throughout the process. For studies spanning multiple days, a data normalization step was performed to correct variation resulting from instrument inter-day tuning differences. Variability among consistently detected biochemical was used to calculate an estimate of overall process variability.

