FIGURE 2.
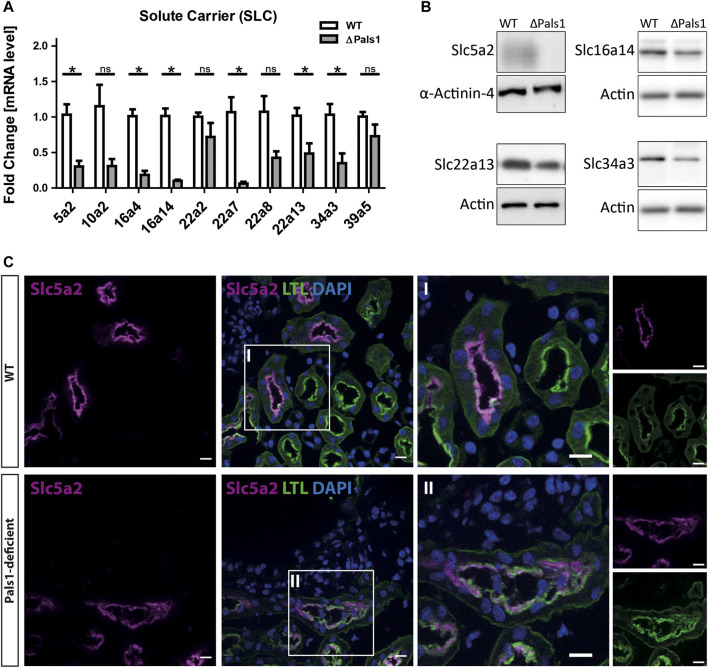
Pals1-dependent expression of abundant members of the solute carrier family members in renal nephrons. (A) Quantitative real-time RT PCR analysis of mRNA levels derived from Pals1-deficient kidneys (∆Pals1) and their wildtype (WT) littermate controls. In Pals1-deficient kidneys, six SLC genes summarized in Table 1 show a reduced mRNA expression in Pals1-deficient kidneys. (B) Western blotting confirmed downregulation on protein level for Slc5a2, Slc16a14, Slc22a13 and Slc43a3. α-Actinin-4 and Actin served as loading controls. (C) Immunohistologic analysis from kidney sections derived from WT and Pals1-deficient mice. The glucose transporter Slc5a2 (magenta) co-localizes with the Lotus tetragonolobus Lectin coupled to fluorescein (LTL, green). The lectin LTL is a marker for proximal tubules in mammalian kidneys. DAPI (blue) labels the nuclei of cells. Although downregulated, Slc5a2 glucose transporters localize at the brush border membrane of proximal tubules in Pals1-deficient mice. Bar = 10 μm.

